Thesis
In my previous article on Taiwan Semiconductor Manufacturing Company Limited (NYSE:TSM), I rated the stock as a “strong buy” explaining that my near-term stock price estimate stood at $238.47, which suggested a 69.8% upside from the stock price at that time of $144. Additionally, I suggested that for 2029, the stock could achieve a cost of $418.49. This last number suggested annual returns of around 33% throughout 2029.
TSMC released Q1 2024 earnings on April 18. TSMC reported earnings of $1.38% per share which beat the consensus by 4.51%, and revenues of $18.87B which beat the consensus by 4.77%.
After re-valuating TSMC’s stock with the newly available information, I arrived at a slightly lower fair price estimate of $231.78 (which is 31.5% above the current stock price of $176.23), and a stock price estimate for 2029 of $400.85. This last target suggests annual returns of 31.5% throughout 2029. For this reason, I maintain my “strong-buy” rating on TSMC.
Overview
Growth Plan
The growth strategy of TSMC consists of expanding and innovating to make its manufacturing processes more efficient. This is the only way they will be able to maintain their dominance since semiconductor manufacturing is a capital-heavy business, and this builds a moat around TSMC since it can offer lower prices because of its higher volume.
Furthermore, TSMC is trying to diversify outside of Taiwan to avoid an interruption in its operations if finally one of the many Chinese threats to invade the island becomes a reality.
How Does TSMC Compare Against Competitors?
TSMC’s market share currently stands at 61%, which is far higher than its most important competitor: Samsung Electronics Co., Ltd. (OTCPK:SSNLF), with an 11.3% market share. Its other two biggest competitors are Global Foundries, Inc. (GFS), with a 5.8% market share, and United Microelectronics Corporation (UMC). Furthermore, TSMC controls around 90% of the manufacturing of AI chips.
Statista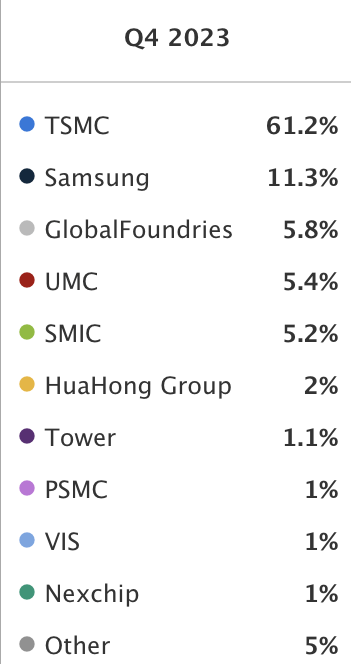
Industry Outlook & Addressable Market
The worldwide semiconductor market is expected to generate revenue of $553B for 2023, and $736.40B for 2027. This means that the market will be growing at a 6.30% CAGR throughout that period.
Statista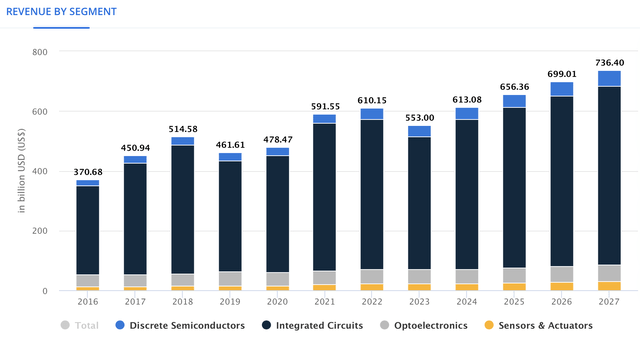
However, that is referring to all semiconductors, not solely foundry services. This market was valued at $106.8B in 2022 and is expected to grow at an 8.1% CAGR throughout 2032, a year in which the market is expected to be valued at $231.5B.
Valuation
I will value it through a DCF model. In the table below, you can observe all the current financial information that will be used to value TSMC’s stocks. The first thing to determine is the WACC. This will be calculated with the already-known formula. The result of this calculation was 10.53%.
Then, D&A expenses will be calculated through a margin tied to revenue, which came out at 25.45%.
| TABLE OF ASSUMPTIONS | |
| (Current data) | |
| Assumptions Part 1 | |
| Equity Market Price | 738,780.00 |
| Debt Value | 31,567.70 |
| Cost of Debt | 1.16% |
| Tax Rate | 14.51% |
| 10y Treasury | 4.289% |
| Beta | 1.07 |
| Market Return | 10.50% |
| Cost of Equity | 10.93% |
| Assumptions Part 2 | |
| CapEx | 25,912.30 |
| Capex Margin | 36.90% |
| Net Income | 26,799.50 |
| Interest | 366.90 |
| Tax | 4,546.90 |
| D&A | 17,873.10 |
| Ebitda | 49,586.40 |
| D&A Margin | 25.45% |
| Revenue | 70,227.0 |
| R&D Expense Margin | 15.73% |
To calculate revenue, I parted from the assumption that TSMC is in practice a commodities company, since its variations in revenue are mainly driven by changes in worldwide semiconductor shipments.
So, the first aspect that will materialize this idea is that I found that TSMC grew 2.16% more than worldwide semiconductor shipments during periods of growth, and contracted 4.31% less during periods of decreasing semiconductor shipments.
However, now, it’s time to predict how much will global semiconductor shipments will grow. I found that during periods of growth, semiconductor shipments grew on average by 5.80%, and during contractions, they decreased on average by -5.68%. Then, I found that on average, expansion periods lasted for three quarters and contraction periods lasted for one year. Then, I will alternate these two pieces of information, which give the following results:
Past and Estimated Semiconductor Shipments (in units) and TSMC revenue (in millions of USD). Quarters in red mean contraction period. (Author’s Calculations)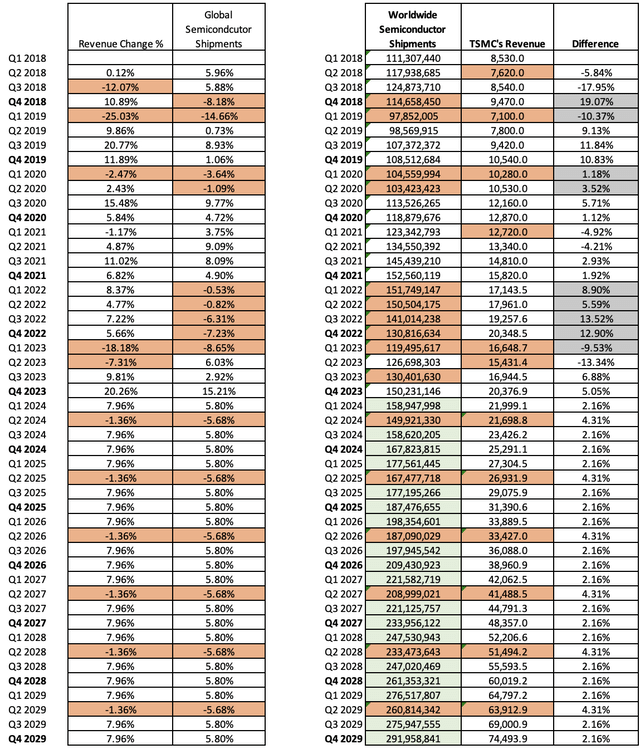
Now, it’s time to calculate net income. The first assumption will be gross margin, which I will maintain at the 2023 level of 54.35%.
Meanwhile, general and administrative expenses will be calculated by obtaining an average expense per employee. This will be done by dividing the total amount of employees in 2023 of 76,478 by the amount of the previously-mentioned expenses in that year (which were $2.32B). The result is an average expense per employee of $30K. Then I will project that TSMC will be hiring 5.66K employees per year, as done during 2021-2023. It’s a high number, so if TSMC ends up hiring less, then it’s better because they will probably be able to allocate that money to CapEx or directly don’t spend it and increase net income and free cash flow.
On the other hand, R&D expenses will be maintained at the current expense rate of 15.73% of gross income.
Now, long-term debt will grow at the 18.3% rate displayed during 2021-2024TTM, meanwhile, short-term debt will be decreasing by 22% annually. Marketable securities will grow at the 19.2% rate displayed by total cash reserves in that same period.
Then, I found that during periods of high interest rates (as now), TSMC has paid 1.16% interest on debt, and has received a 27.25% return from its marketable securities. Meanwhile, during low interest rate periods such as 2019, TSMC was paying 1.69% interest on debt and receiving an 11.68% annual return on its marketable securities. And, how I am going to alternate those numbers in the project? Well, all the years will be assumed to be as low interest rates period except 2024 and 2027. In this last year, I am expecting the FED to increase interest rates again. If you want to know the detailed explanation behind this, you can go to the valuation section of my article on JPMorgan Chase & Co. (JPM).
Then, the average currency exchange income will be $142.27M across the project, in line with 2021-2024TM.
The last step for this section is income taxes payable, which I projected by using the current effective tax rate on TSMC of 14.51%.
Author’s Calculations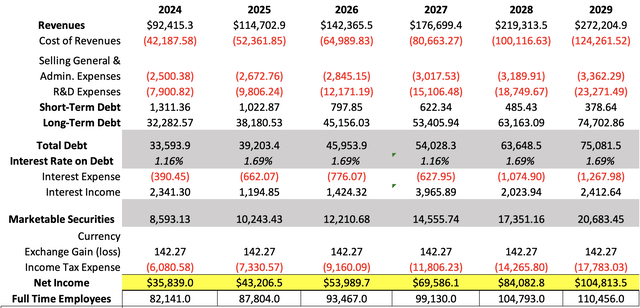
The last three things to obtain are CapEx, perpetuity growth rate, and the potential future stock price for the year 2029. For the first one, I will assume that it will continue to grow at a 7.420% annual rate in 2021-2024.
Then, the perpetuity growth rate will be calculated by dividing the estimated 3-5y long-term EPS growth rate of 23.81% by the difference between that growth rate and the WACC of 10.53%. The result is 1.792%.
Lastly, the potential stock price for 2029 will be calculated by obtaining the future enterprise value, which is done by using the undiscounted cash flows that are highlighted in green in the model below. Then, I assume that current assets will grow at a pace of 7.420%, which corresponds to the average annual change during 2022-2024TTM. All the other elements, long & short-term debt, and marketable securities were calculated in the net income projection part. Then with these numbers, I obtain the potential future equity value, which leads to the future stock price.
Author’s Calculations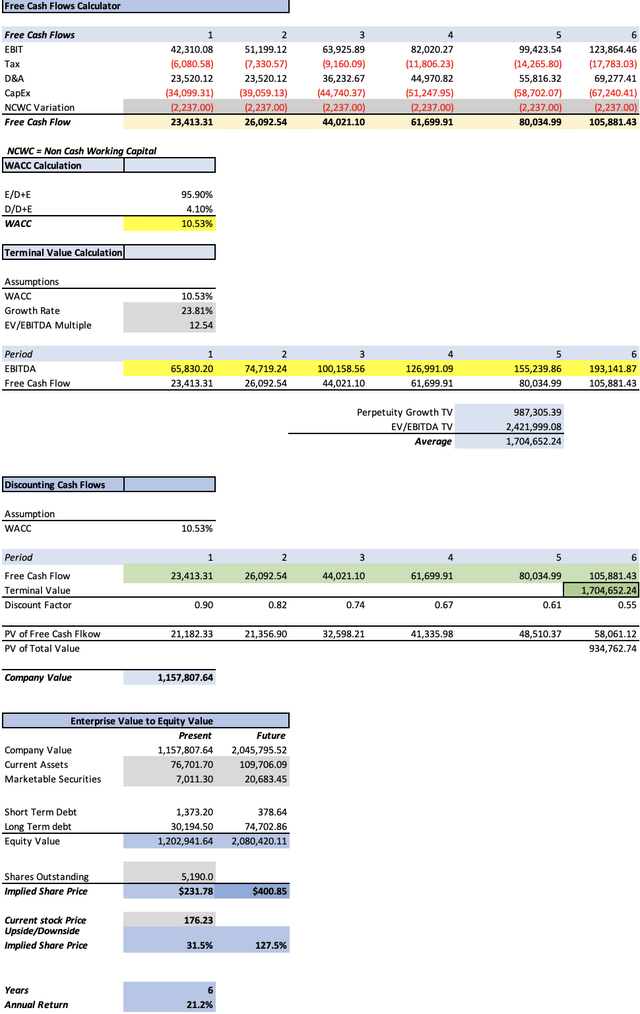
As you can see, the suggested stock price at which TSMC should be trading now is $231.78, which implies a 31.5% upside from the current stock price of $176.23. Then, the model suggests that for 2029, the stock should be trading at $400.85, which implies annual returns of 15.4% throughout 2024-2029.
Risks to Thesis
The main risk for TSMC is that it’s so big that everyone is trying to take a piece of its pie. This hostile environment for TSMC has as its main effect, that TSMC maintains an elevated CapEx, and operates under a constant downward pressure on margins since it cannot hike prices because it would make its clients search for other manufacturers.
The second risk is geopolitical, since TSMC’s main Taiwan operations are at direct risk of foreign aggression if China does decide to invade Taiwan. As I explained in a previous article, I think that TSMC would still be able to operate normally but under the new Chinese administration (in the case China invades and annexes Taiwan). Nevertheless, the Chinese government is characterized because of authoritarianism, and since TSMC would be considered of national interest, a hypothetical Chinese government-run TSMC would probably be banned from doing business with Western-aligned countries.
Lastly, there is the risk AI chip demand cools down abruptly, this would considerably affect the company since it’s been the primary growth driver for semiconductor & software stocks recently.
Fair Price Estimate Evolution
My current fair price estimate of $231.78, is 87.72% above my first fair price estimate of $123.47. Nevertheless, since my third article, my fair price estimate has declined by 2.33%. The reason for this was mainly changes in the company’s financial condition (balance sheet mainly) that affected the current equity value of TSMC. This, of course, impacted slightly my fair price estimate.
Author’s Calculations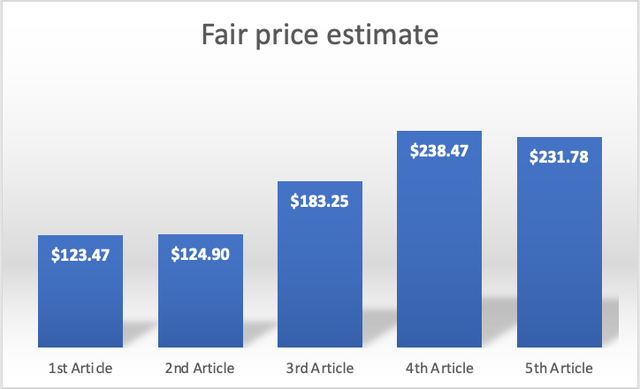
Conclusion
In conclusion, TSMC still presents a compelling opportunity. There are still many sentiment catalysts in play, one of them being the strong demand for AI chips for data centers.
According to my model, the fair price of TSMC could be $231.78, which is 31.5% above the current stock price of $176.23. Meanwhile, the future stock price stands at $408.85, which translates into annual returns of 31.5% throughout 2029.
For this reason, I reiterate my “strong-buy” rating on TSMC. In future quarters I will continue to observe how TMSC meets my quarterly targets, and in case it misses it, if they at least are heading to surpass them by the end of the year.
Editor’s Note: This article discusses one or more securities that do not trade on a major U.S. exchange. Please be aware of the risks associated with these stocks.
Read the full article here




Leave a Reply