Some investors have said that 2023 feels a lot like the tech bubble, and I can see why.
YCharts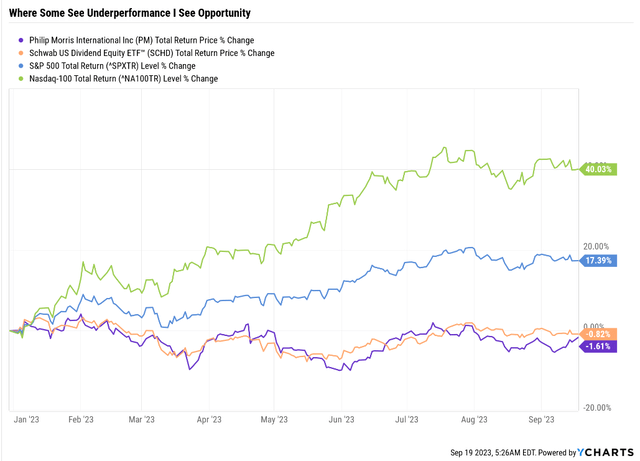
From 1997 to 2000, the Nasdaq tripled while the value stocks got cut in half. When you can make instant riches in red-hot tech, who cares about boring old value or dividend stocks?
While value hasn’t been crashing (some sectors have), another historic opportunity might be forming.
Daily Shot 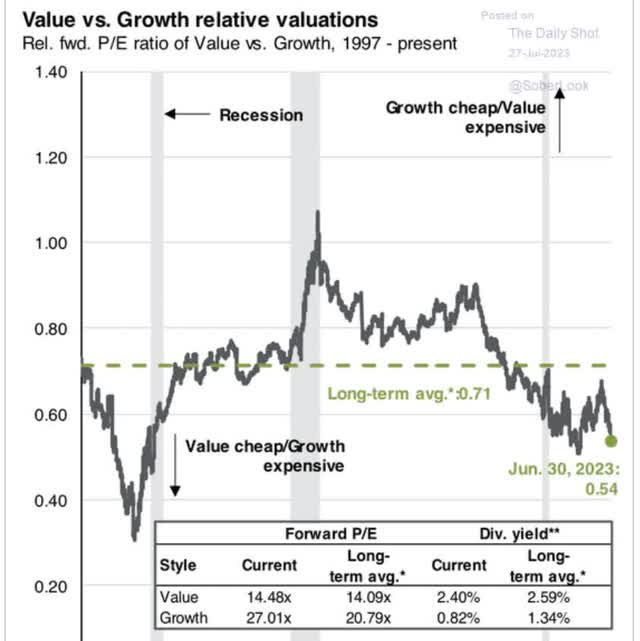
Value is now the 3rd most undervalued relative to growth in history.
- the roaring 1920s were the biggest growth vs. value bubble
- the 1990s were the 2nd
- the 2010s is the 3rd biggest.
Portfolio Visualizer Premium 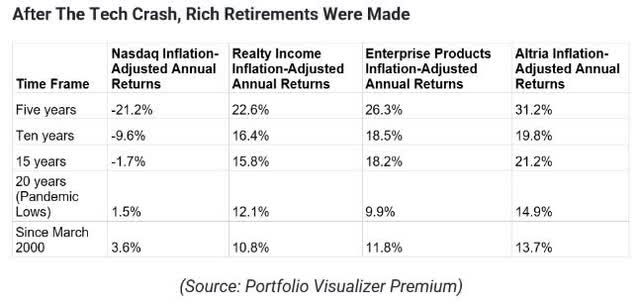
Valuations mean nothing in the short term. Unless things get so extreme and there is some catalyst.
Historically, value will outperform growth only in the recovery phase after a recession has ended.
| State Of The Economy | Annual Return Advantage Value Overvalued | Annual Return Advantage Value Undervalued |
Annual Return Advantage Value Trading Historical Return |
| Expansion | -7% | 1% | 0% |
| Slowdown | -16% | 5% | -1% |
| Contraction | -4% | 0% | -2% |
| Recovery | 1% | 4% | 3% |
(Source: Vanguard.)
But when value is extremely undervalued, like now, as soon as the economy starts slowing, value starts to shine brightest.
Portfolio Visualizer 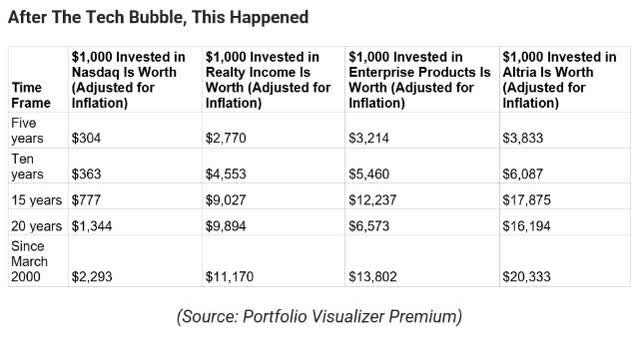
These are just some examples, not a prediction for any of these particular stocks.
But the point is this. Value is extremely cheap because growth has been so popular for so long.
To heck with dividends, all I need is tech!” – 2000 investors
“To heck with dividends, all I need is tech!” – 2023 investors.
So let me show you why Philip Morris International Inc. (NYSE:PM), which is flat on the year (as are high-yield blue chips ala Schwab U.S. Dividend Equity ETF™ (SCHD)), is a blessing, not a curse.
Please don’t chase the momentum of tech (which has almost certainly run its course) when you can get such prosperous retirement bargains from dividend kings like this.
- PM just hiked its dividend for the 54th consecutive year.
So, let me show you why this is a beautiful time for long-term high-yield investors to lock in incredible opportunities in this dangerous market.
If I had to buy just one tobacco stock to own forever, with no ability to sell ever, PM would be it.
Why It’s A Great Time To Buy Philip Morris
YCharts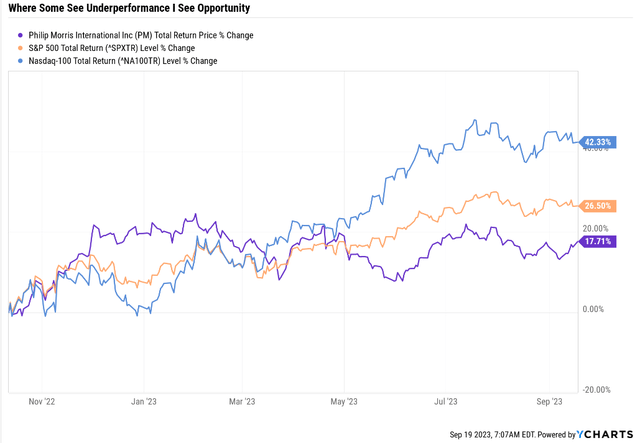
Off the 2022 lows, PM is up nicely. It just hasn’t kept up with the magnificent 7-driven S&P and Nasdaq.
| Metric | 2022 Growth Consensus | 2023 Growth Consensus | 2024 Growth Consensus |
2025 Growth Consensus |
| Sales | 1% | 14% | 7% | 7% |
| Dividend | 2% | 2% | 3% | 6% |
| EPS | -2% | 4% | 9% | 11% |
| Operating Cash Flow | -9% | -1% | 11% | 13% |
| Free Cash Flow | -13% | -5% | 12% | 16% |
| EBITDA | -3% | 11% | 12% | 9% |
| EBIT (operating income) | -4% | 13% | 10% | 9% |
(Source: FactSet Research, FAST Graphs.)
But there is nothing broken about PM’s short-term growth outlook.
We have a strong acceleration in dividends, earnings, and free cash flows as the $9 billion investments made into iQOS start to pay dividends.
Philip Morris International’s, or PMI’s, statement of purpose is to completely replace cigarettes with less harmful alternatives as soon as possible. The latest medium-term targets from management imply strong growth over the next three years, and the company aims to generate over half of its revenue from non combustibles by 2025. We regard this as ambitious, perhaps a stretch goal, but we are in no doubt that if events go their way, PMI could be the first Big Tobacco firm since the 1990s to diversify half of its cash flow away from cigarettes.” – Morningstar.
How are PM’s smoke-free future plans going?
earnings presentation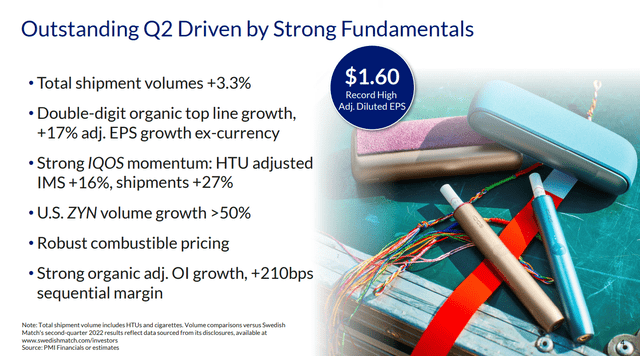
Things are going fantastic at PM, with positive volume growth, something no other tobacco company can report.
iQOS volumes are up 27%, while Zyn (from Swedish Tobacco acquisition) is up over 50%.
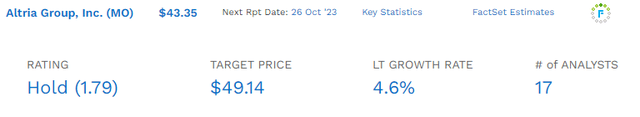
That’s despite MO throwing a lot of money at On!, its own oral nicotine pouch brand.
Operating margins rose 2.1% in the second quarter, showing strong pricing power.
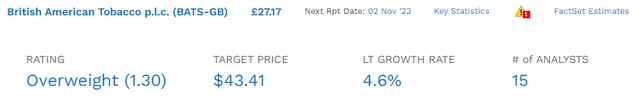
PM is the global leader in heat sticks, while BTI is the leader in vaping. While vaping is more prevalent among younger nicotine users, there is a big reason why PM has invested $9 billion and counting ($1 billion per year) into iQOS heat sticks.
Under current market conditions, heatsticks, the cigarette-like sticks used in the iQOS device, are generally taxed at lower rates than cigarettes. The economics of the distribution of heatsticks, therefore, is highly favorable to the manufacturer. Net revenue per pack is 2.4 times that of a pack of cigarettes, and the gross margin is a whopping ten percentage points higher than cigarettes, at about 75%. Selling and overhead expenses are likely to be higher than cigarettes at current volumes, but at scale, we think heatsticks can more than replicate premium cigarette EBIT margins.” – Morningstar (emphasis added).
Heat sticks are more profitable than cigarettes, while vaping is not. BTI is still losing money on its RRP products, though it believes it can break even next year.
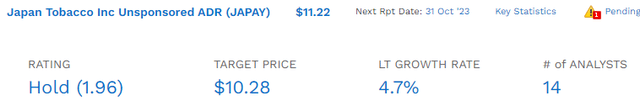
MO’s recent acquisition of NJOY is also vaping-focused, while its attempts to break into heatsticks with a joint venture with Japan Tabacco will compete head-to-head with Philip Morris, the king of heat sticks.
earnings presentation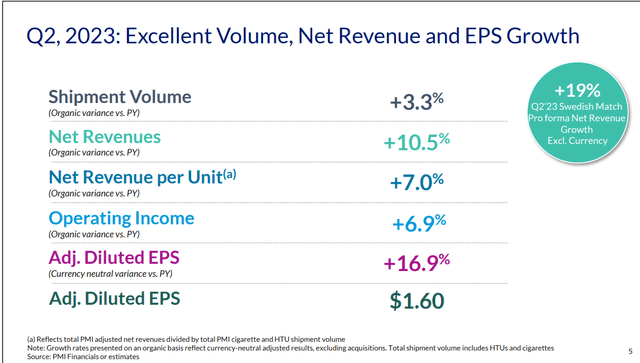
PM raised prices by 7% per pack (including heat sticks) on top of industry-leading volume growth.
Even looking ahead to 2024 when it won’t be making a significant acquisition, analysts expect 7% sales growth and 7% in 2025. Those sales growth levels are on par with the best years of growth for tobacco companies ever.
I’m talking about breaking into new developing markets with 40+% smoking rates levels of growth.
For context, the fastest sales growth for MO in the last 20 years was 5% annually over the last 15 years.
For BTI, it was 5.7% annual growth over the last six years, including the Reynolds acquisition.
7% stable sales growth for PM with the capacity to boost margins as it scales iQOS and Zyn and eventually starts buying back stock?
FactSet Research Terminal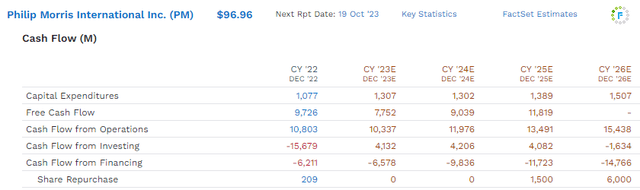
From 2023 through 2026, PM’s free cash flow could almost double, and analysts think it will achieve sufficient deleveraging from buying Swedish Match to start buying back stock in 2025.
By 2026, $6 billion in annual buybacks would be 4% of the stock at current valuations.
- 2.65% buyback rate based on the 56% stock price upside analysts forecast in 2026
- based on historical fair value X 2026 EPS consensus.
So basically, you have a PM with the potential for 2% to 3% annual buyback-fueled EPS growth (and dividend growth) on top of 7% sales growth and some modest margin expansion.
In fact, from 2022 through 2026, analysts now expect net income growth of 11%. Double-digit growth from a tobacco company? Yes, because PM isn’t a tobacco but a nicotine sales company.
earnings presentation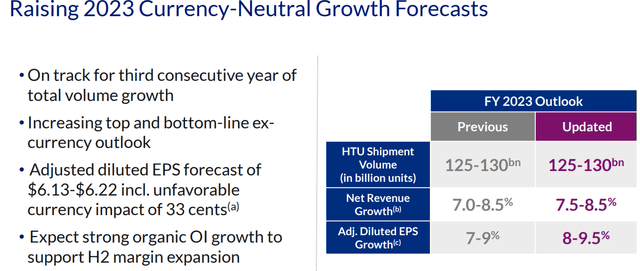
PM isn’t just crushing it on volumes this year; it’s been three consecutive years of growing volumes. Heat sticks are now big enough to offset cigarette declines.
While the strong U.S. dollar is expected to knock about 5% off earnings this year, PM says it will grow close to 9% this year in constant currency.
The S&P 500 is expected to post 2% EPS growth this year, driven entirely through buybacks from big tech.
Today, PM is a better growth stock than Apple or the S&P.
earnings presentation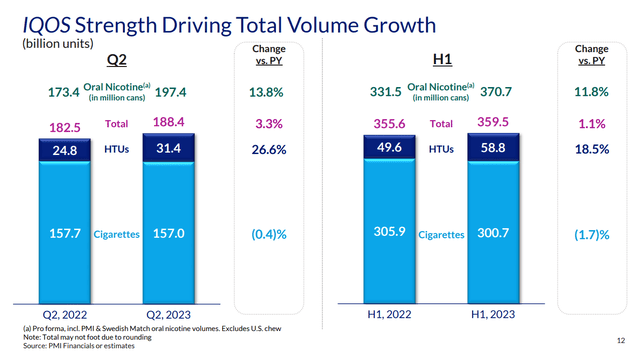
While MO faces double-digit volume declines and BTI faces high single digits, PM’s volume decline for cigarettes in the first half was 2%.
earnings presentation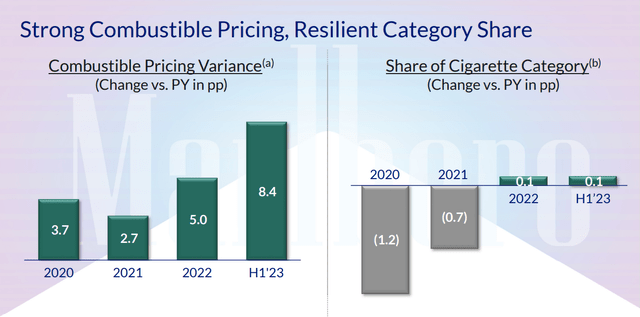
PM’s brand power and markets are so good that it has been winning market share even with accelerating cigarette price hikes.
iQOS volumes soared 19% while oral nicotine was up 12%, driven almost entirely by Zyn, a tobacco-free option.
earnings presentation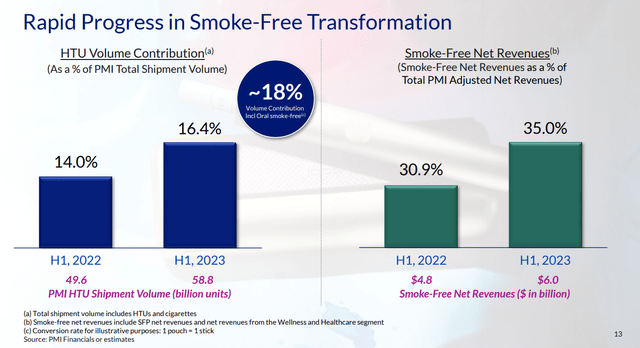
Smoke-free now makes up 16% of volume, but thanks to preferential tax treatment on RRPs, 35% of PM’s sales are from RRPs.
Management says it’s on track to hit 50% by the end of 2025.
earnings presentation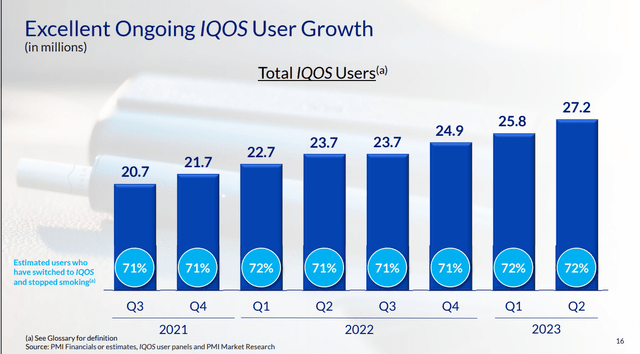
The exit from Ukraine and Russia caused iQOS user growth to halt, but now it’s back to growing at 15% per year.
earnings presentation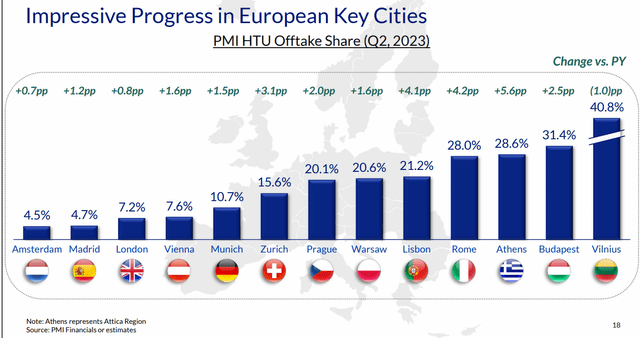
In Europe, we can see how PM can grow market share in cities where iQOS has a 25+ market share.
That’s quite a growth runway for the company in one of its core markets.
earnings presentation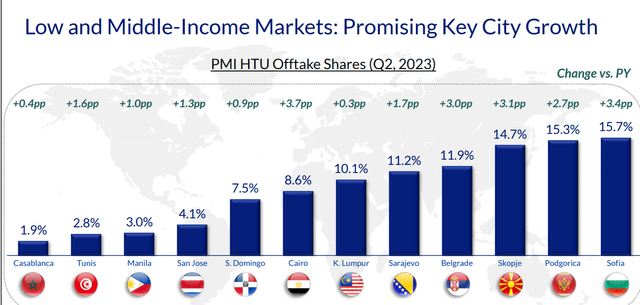
Whether you look at rich or low-income markets, PM has plenty of room to grow, and that’s not counting the 160 countries iQOS hasn’t even launched in yet.
earnings presentation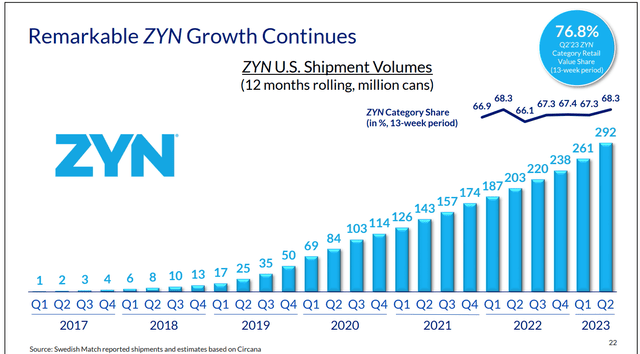
ZYN is PM’s new oral nicotine brand, which is why it bought Swedish Match. It’s still growing like a weed, and PM has the money to accelerate its adoption worldwide, including in the U.S. PM is now back in the U.S. and a truly global titan.
Only time will tell whether oral nicotine brand users are as loyal as cigarette users. For now, heat stick users seem very brand loyal.
earnings presentation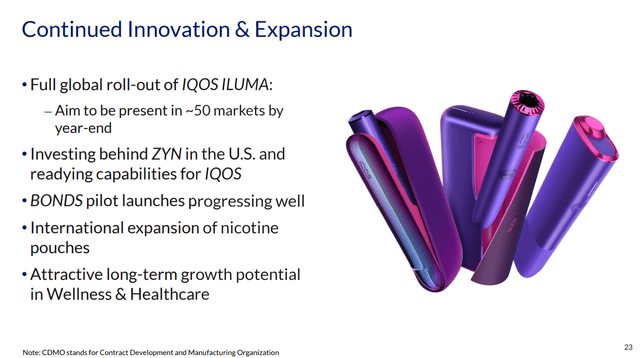
PM is rolling out the new Iluma iQOS device worldwide by year-end in all 50 iQOS markets.
Iluma is the new tech that gets around BTI’s patents, which blocked iQOS sales in the U.S.
FactSet Research Terminal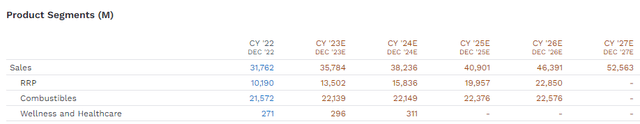
Like Morningstar, analysts are skeptical that PM can hit 50% RRP sales by 2025. They think it will take until 2026, but RRP sales will help PM grow total revenue at 10% annually from 2023 to 2027.
That’s not earnings, that’s sales. And few large companies, much less a tobacco company.
The Best Growth Profile In Tobacco
PM has been working on iQOS since 2012 and, by year-end, will have invested over $10 billion into it.
FactSet Research Terminal FactSet Research Terminal FactSet Research Terminal FactSet Research Terminal FactSet Research Terminal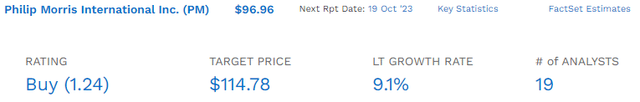
No one else can match PM’s long-term expected growth rate, which is at the low end of management guidance.
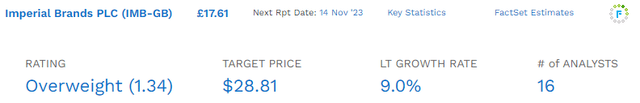
Sure, Imperial Brands is close, but do you want to own a 54-year dividend growth streak dividend king with an A-credit rating or a BBB-rated 2nd-tier tobacco company that had to slash its dividend by 33% in 2020?
PM has the best management, the 2nd best long-term risk management, according to S&P, the best credit rating, and is the global leader in RRPs.
Not just RRPs, but the kind of RRP that has better margins than cigarettes!
But wait, it gets better. While PM might be flat for the year, it’s been growing its fundamentals, so the valuation is much improved.
A Wonderful Company At A Wonderful Price
| Metric | Historical Fair Value Multiples (14-Years) | 2021 | 2022 | 2023 | 2024 | 2025 |
12-Month Forward Fair Value |
| 14-year average yield | 4.73% | $103.59 | $106.55 | $109.94 | $113.53 | NA | |
| Earnings | 17.07 | $103.79 | $102.08 | $106.18 | $116.08 | $127.85 | |
| Average | $103.69 | $104.27 | $108.02 | $114.79 | $127.85 | $112.97 | |
| Current Price | $96.96 | ||||||
|
Discount To Fair Value |
6.49% | 7.01% | 10.24% | 15.53% | 24.16% | 14.17% | |
|
Upside To Fair Value (Including Dividends) |
6.94% | 7.54% | 11.41% | 18.39% | 31.86% | 21.87% | |
| 2023 EPS | 2024 EPS | 2021 Weighted EPS | 2022 Weighted EPS | 12-Month Forward EPS | 12-Month Average Fair Value Forward PE |
Current Forward PE |
|
| $6.22 | $6.80 | $1.67 | $4.97 | $6.64 | 17.0 | 14.6 |
PM historically traded at 17X earnings and today trades at 14.6, a 14% discount.
That means that in the next 12 months, a return to fair value would deliver a 22% total return.
If you think the S&P or Nasdaq has a 22% return potential in the next year, I have a bridge in Brooklyn to sell you;)
| Rating | Margin Of Safety For Very Low-Risk 13/13 Ultra SWAN Quality | 2023 Fair Value Price | 2024 Fair Value Price | 12-Month Forward Fair Value |
| Potentially Reasonable Buy | 0% | $108.02 | $114.79 | $112.97 |
| Potentially Good Buy | 5% | $102.62 | $109.05 | $107.32 |
| Potentially Strong Buy | 15% | $91.82 | $97.57 | $96.02 |
| Potentially Very Strong Buy | 25% | $76.97 | $86.09 | $84.73 |
| Potentially Ultra-Value Buy | 35% | $70.22 | $74.61 | $73.43 |
| Currently | $96.96 | 10.24% | 15.53% | 14.17% |
| Upside To Fair Value (Including Dividends) | 16.77% | 23.75% | 21.87% |
PM is pennies away from becoming a strong buy.
Consensus 2025 Total Return Potential
FAST Graphs, FactSet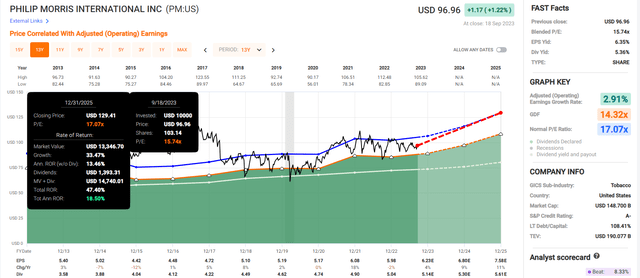
Buffett-like return potential from PM. Now, compare that to the S&P 500.
FAST Graphs, FactSet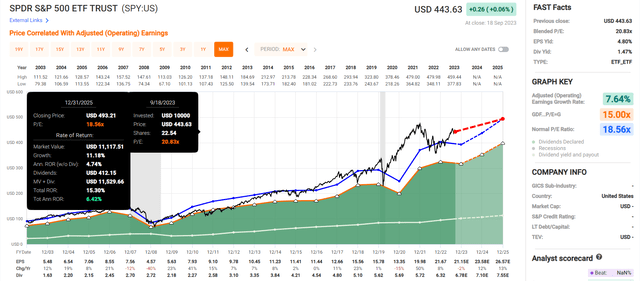
3X the return potential of the S&P through the end of 2025.
Consensus 2029 Total Return Potential
FAST Graphs, FactSet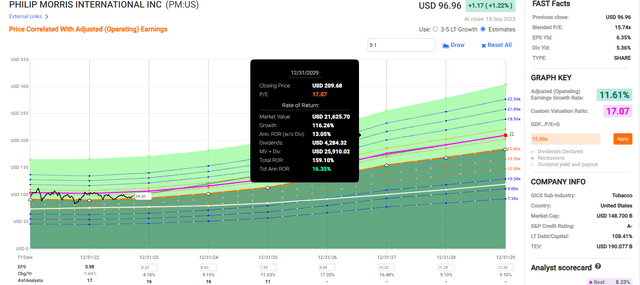
John Templeton-like returns potential from PM. Now, compare that to the S&P 500.
FAST Graphs, FactSet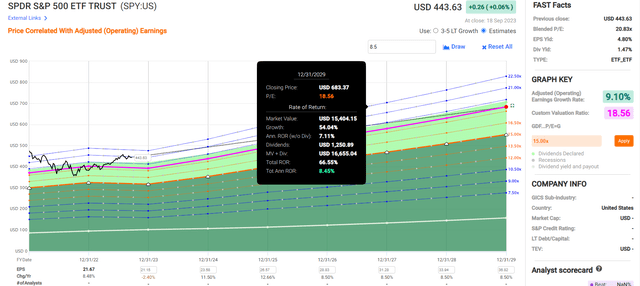
Consensus 2033 Total Return Potential
- yield: 5.4%
- growth 9.1%
- LT total return potential: 13.5% annual
- valuation discount: 14%
- 10-year valuation boost: 1.5% per year
- 10-year consensus total return potential: 5.4% yield + 9.1% growth + 1.5% valuation boost = 15.0% CAGR vs 8.7% S&P 500
- 10-year consensus total return potential: 305% vs 130% S&P.
Over the next decade, analysts expect PM to quadruple while the S&P is expected to deliver 2.5X weaker returns.
Risk Profile: Why Philip Morris Isn’t Right For Everyone
There are no risk-free companies, and no company is right for everyone. You have to be comfortable with the fundamental risk profile.
Philip Morris Risk Summary
Our uncertainty rating for Philip Morris International is medium. Any investor owning tobacco stocks should have the stomach for fat-tail risks, such as the recent CAD 13 billion judgment against the industry in Quebec, Canada. The European players’ litigation risk is substantially lower, as most countries do not have a class-action legal process. Nevertheless, we regard government and legal risks as low-probability events with high potential impacts that investors should be aware of.
In general, we believe government regulation does little to affect tobacco manufacturers’ economic moats or cash flows. In some cases, regulation limits competition lowers cost, and strengthens pricing power. Plain packaging and nicotine controls may be different, however, potentially facilitating trading down and weakening the addictive power of cigarettes.
Philip Morris’ functional currency is the euro, which reports in U.S. dollars. It also has exposure to currencies too small to hedge in large amounts on the open market. Although it has something of a natural hedge, with around 25% of its costs in euros almost offsetting the roughly 30% of its revenue that is denominated in euros, strength in the U.S. dollar can have a significant and detrimental impact on Philip Morris’ earnings, and this risk has been evident in recent years. The social impact of tobacco products is rated as a severe risk in Sustainalytics’ ESG risk rating of PMI. We assume a mid-single-digit volume decline rate in the cigarette industry. Still, we flex this assumption in our scenario analysis to reflect the risk that the decline rate could accelerate. Although the externalities of smoking have largely been internalized, the risk remains of increased taxation and/or operating costs.” – Morningstar.
PM’s Risk Profile Includes
- regulatory risk (globally, including menthol bans, nicotine regulations, RRP tax rates, and plain packaging laws)
- smoke-free transition risk (PM is the industry leader)
- litigation risk (lower than in the US due to lack of class action laws)
- M&A execution risk (Swedish Match is the largest deal PM has ever done)
- supply chain disruption risk
- black swan geopolitical risks (like the Russian invasion)
- labor market risk (tightest job market in 50 years globally)
- currency risk (Swedish match reduces this).
How do we quantify, monitor, and track such a complex risk profile? By doing what big institutions do.
Long-Term Risk Management Analysis: How Large Institutions Measure Total Risk Management
DK uses S&P Global’s global long-term risk-management ratings for our risk rating.
- S&P has spent over 20 years perfecting its risk model
- which is based on over 30 major risk categories, over 130 subcategories, and 1,000 individual metrics
- 50% of metrics are industry-specific
- this risk rating has been included in every credit rating for decades.
The DK risk rating is based on the global percentile of a company’s risk management compared to 8,000 S&P-rated companies covering 90% of the world’s market cap.
PM Scores 83rd Percentile On Global Long-Term Risk Management
S&P’s risk management scores factor in things like:
- supply chain management
- crisis management
- cyber-security
- privacy protection
- efficiency
- R&D efficiency
- innovation management
- labor relations
- talent retention
- worker training/skills improvement
- occupational health & safety
- customer relationship management
- business ethics
- climate strategy adaptation
- sustainable agricultural practices
- corporate governance
- brand management.
PM’s Long-Term Risk Management Is The 125th Best Risk Manager In The Master List (75th Percentile In The Master List)
| Classification | S&P LT Risk-Management Global Percentile |
Risk-Management Interpretation |
Risk-Management Rating |
| BTI, ILMN, SIEGY, SPGI, WM, CI, CSCO, WMB, SAP, CL | 100 | Exceptional (Top 80 companies in the world) | Very Low Risk |
| Strong ESG Stocks | 86 |
Very Good |
Very Low Risk |
| Philip Morris | 83 |
Very Good |
Very Low Risk |
| Foreign Dividend Stocks | 77 |
Good, Bordering On Very Good |
Low Risk |
| Ultra SWANs | 74 | Good | Low Risk |
| Dividend Aristocrats | 67 | Above-Average (Bordering On Good) | Low Risk |
| Low Volatility Stocks | 65 | Above-Average | Low Risk |
| Master List average | 61 | Above-Average | Low Risk |
| Dividend Kings | 60 | Above-Average | Low Risk |
| Hyper-Growth stocks | 59 | Average, Bordering On Above-Average | Medium Risk |
| Dividend Champions | 55 | Average | Medium Risk |
| Monthly Dividend Stocks | 41 | Average | Medium Risk |
(Source: DK Research Terminal.)
PM’s risk-management consensus is in the top 25% of the world’s best blue-chips, on par with the likes of:
- Visa (V): Ultra SWAN
- T. Rowe Price (TROW): Ultra SWAN dividend aristocrat
- Lowe’s (LOW): Ultra SWAN dividend king
- Target (TGT): Ultra SWAN dividend king.
The bottom line is that all companies have risks, and PM is very good at managing theirs, according to S&P.
How We Monitor PM’s Risk Profile
- 21 analysts
- three credit rating agencies
- 24 experts who collectively know this business better than anyone other than management
- and the bond market for real-time fundamental risk assessment.
When the facts change, I change my mind. What do you do, sir?” – John Maynard Keynes.
There are no sacred cows here. Wherever the fundamentals lead, we always follow. That’s the essence of disciplined financial science, the math behind retiring rich and staying rich in retirement.
Bottom Line: Philip Morris Is The King Of Tobacco And Has A Very Bright Future
Everyone in the tobacco industry talks a big game about going smoke-free, but PM is actually delivering on that.
They were the first mover in the industry for heat sticks and are now raking in better gross margins on iQOS than on cigarettes.
Their plans for a smoke-free future are largely on track, though it might take them an extra year to hit 50% RRP sales.
They still have yet to prove that the Vectura (asthma inhaler company in the UK) deal for $1.5 billion will work out, but it’s doubling down on inhalers.
They just bought an Israeli cannabis company for $650 million.
MO paid $1.85 billion for a 50% stake in Cronos during the cannabis bubble.
Syqe’s chief product is a metered-dose pharmaceutical-grade inhaler that allows patients to measure an exact dose of medical cannabis.” – MJBizdaily.
PM waited until the bubble had burst and paid about 6X less than MO for a company that sells something with synergy with the asthma inhalers they now sell.
The point is that PM is doing everything right. Rapidly moving into RRPs, including brand power that is the envy of the industry.
If I had to own just one tobacco stock for the rest of my life and never sell? This would be it.
Read the full article here