
Trinet Group Inc. (NYSE:TNET) works primarily with SMBs, helping them outsource HR, payroll, and more. Founded in 1988, they became public in 2014. Below is their share price performance since IPO:
dividend channel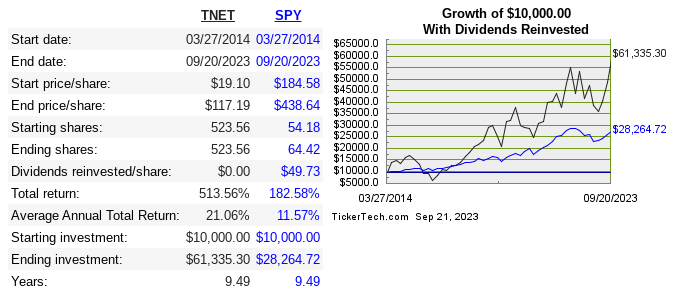
Their revenue is split between insurance services and professional services.
TNET 2023 10-K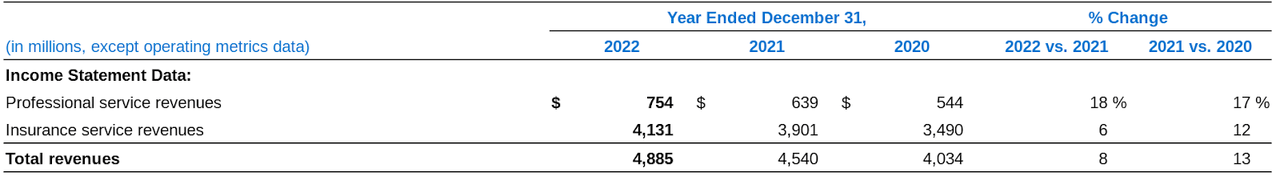
The core of their business is PEO services. One of their key differentiators is the industry focus for each PEO services, with six different industries in total. Let’s look next at their return metrics versus peers:
|
Company |
Revenue 10-Year CAGR |
Median 10-Year ROE |
Median 10-Year ROIC |
EPS 10-Year CAGR |
FCF/Share 10-Year CAGR |
|
TNET |
17% |
47.7% |
25.5% |
28.3% |
19.7% |
|
PAYX |
8% |
41.3% |
36.6% |
10.7% |
7.6% |
|
ADP |
6.7% |
43.8% |
30% |
11% |
11.9% |
|
PCTY |
31.3% |
16.5% |
13.8% |
n/a |
73.6% |
|
NSP |
10.6% |
160.6% |
36.2% |
19.5% |
33.5% |
Source
Revenue and profit at all levels hit a record high in 2022. All margins have expanded over the past 15 years, and the share price is accordingly also at an all-time high recently. They have 6.7% insider ownership, and the current CEO has been in the role for 15 years now, more than their entire life as a public company.
Q2 Performance
They consistently beat earnings estimates and the past quarter was no exception.
SeekingAlpha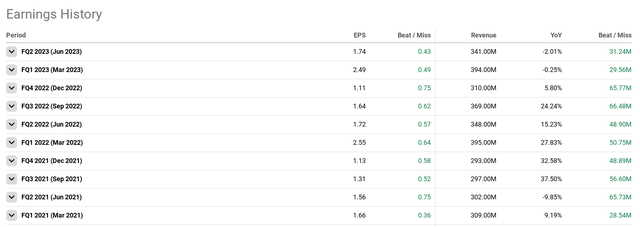
While they didn’t beat as much as the past few quarters, they are still putting up strong results. I would argue that they are quite recession resistant, and the past few quarters have borne this out. The macro consensus was an expectation of a recession, but whether that still happens or not, TNET is able to perform well. I expect the good results currently to add some premium to the share price, but more on that later in the valuation section.
Capital Allocation
The company is still in growth mode, and has successfully reinvested earnings internally and acquired other businesses. Being a services business, they are capital light, so revenue should be able to grow at a faster rate than total asset growth. They haven’t had a need to return capital to shareholders, but they have diluted when making acquisitions on a cash and stock deal. Below is a closer look at where capital was allocated, in USD millions:
|
Year |
2013 |
2014 |
2015 |
2016 |
2017 |
2018 |
2019 |
2020 |
2021 |
2022 |
|
EBIT |
66 |
87 |
78 |
124 |
217 |
251 |
268 |
368 |
455 |
499 |
|
FCF |
90 |
133 |
112 |
105 |
215 |
-147 |
426 |
510 |
178 |
506 |
|
Acquisitions |
195 |
0 |
5 |
12 |
29 |
|||||
|
Debt Repayment |
452 |
274 |
46 |
37 |
38 |
22 |
22 |
256 |
370 |
|
|
Repurchases |
7 |
37 |
62 |
28 |
47 |
129 |
168 |
83 |
512 |
|
|
SBC |
6 |
11 |
18 |
26 |
32 |
44 |
41 |
43 |
50 |
62 |
Risk
There isn’t a lot of fundamental business risk here. They continued to grow revenue and earnings during the pandemic.
They do perpetually carry a bit of long term debt, but it hasn’t necessarily grown simultaneously as sales grow, and right now it can be easily paid off if that were the focus. Long term debt is at $496 million with $482 in cash and cash equivalents.
The biggest risk would be growth rates slowing and competitors capturing more market share over the long run and/or potentially overpaying. I do naturally expect some mean reversion in their returns on capital and margins at these levels, but I don’t see any major disruptive threat to their business model.
Valuation
Anytime I come across a business that has high ROIC in combination with a high retention rate, I am interested in learning more. If I then find the price to be reasonable, then a case for investing can easily be made.
Automation, whether from AI or any other source, will always be causing changes to the labor market overall. The very nature of employment is very different than decades prior thanks to technology, but this doesn’t change the fact that most employees in the US will still work for a SMB.
Big companies will never again provide most of the jobs in the economy, so somebody like TNET should have a long and fairly stable runway, even if full time employment changes drastically over time.
Let’s first look at the multiples compared to peers, followed by the dcf:
|
Company |
EV/Sales |
EV/EBITDA |
EV/FCF |
P/B |
Div Yield |
|
TNET |
1.2 |
10.1 |
13.1 |
6.4 |
n/a |
|
PAYX |
8.1 |
18.3 |
25.7 |
11.8 |
2.9% |
|
ADP |
5.7 |
23.2 |
27.1 |
27.9 |
2% |
|
PCTY |
8.2 |
44.9 |
37.1 |
11.8 |
n/a |
|
NSP |
0.5 |
11.8 |
15.1 |
27.4 |
2.4% |
moneychimp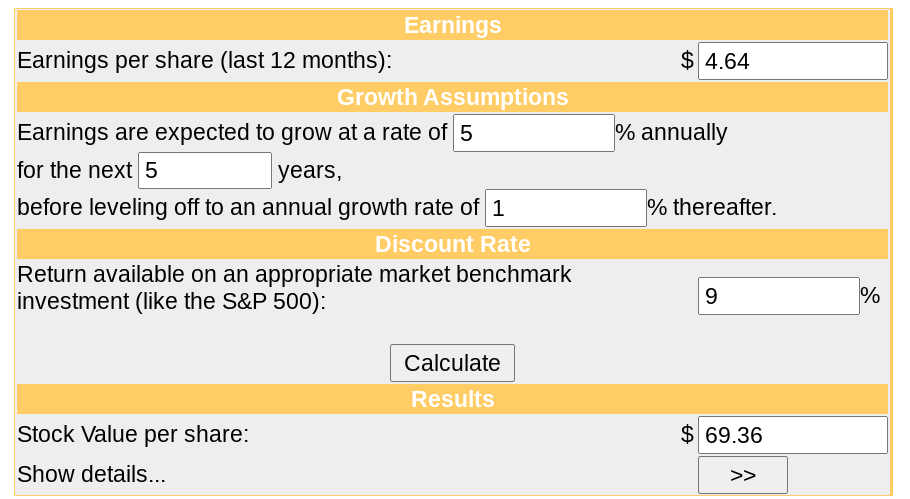
I’m bullish on the company long term, but I think the market has overreacted as far as the future earning power of TNET from here. I also think they are executing well, and would like to see more of FCF being used to reduce share count over time, in addition to continued, smaller acquisitions.
Because margins, sales, and earnings have recently been at all-time highs, the share price has become too overheated. Don’t let the low multiples lead you to believe the stock is undervalued. I do think my EPS projections are fairly conservative, but I would like more time to see if the share price can cool down from all this optimism. I give this stock a “hold” rating.
Conclusion
There is no question that TNET is a high quality company within the small-cap space. Their business model is resilient even in recessionary times, and the past year has seen them achieve record revenue and profits. This good news qualitatively has brought along with it a price tag that reflects far too much optimism for me, even though I’m bullish on the company.
This is absolutely a company worth following for a long term investment, but right now isn’t the time to act.
Read the full article here