
Every day, I spend one hour posting daily charts for our members in a special chat room.
Why? Because it’s essential to see the big picture, the “God’s eye view” of the economy, interest rates, and stock market.
And also, I occasionally come across a chart that can slap you with a Warren Buffett-style investing idea.
Be greedy when others are fearful and fearful when others are greedy.” – Warren Buffett.
Daily Shot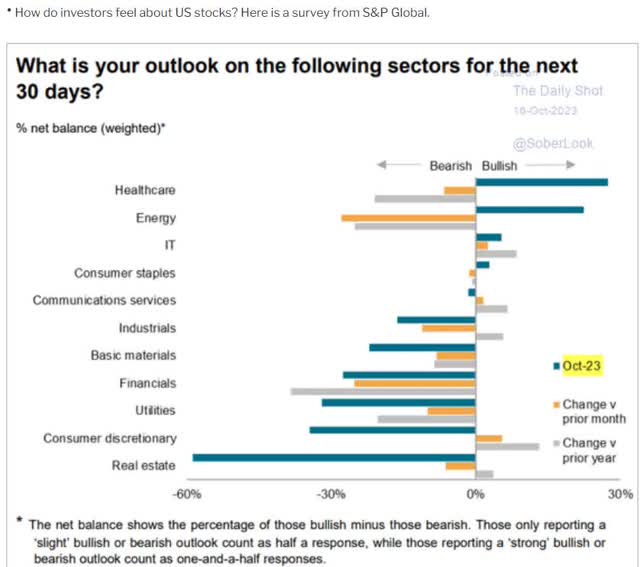
Investor sentiment around real estate investment trusts, or REITS, has swung from just barely bearish to “my God sell everything! NOW!” terror and disgust.
In fact, the last time investors hated REITS this much? March 2009! At the bottom of the Great Recession, a 57% crash, REITs fell 68% during that crash.
That is what it took for REITs to be as despised as they are today.
Think back to March 2009. The economy is melting down. The financial system is in free fall. Some people fear capitalism itself is about to die.
What about today? Retail spending for September just came in 3X stronger than expected.
It’s the strongest job market in 54 years.
Corporate earnings are expected to grow 11% next year and 13% the year after that, and the “Magnificent 7” earnings growth is expected to power tech earnings 63% higher over 3 years.
- I personally believe this is “hopium,” but that’s the consensus.
Even if you don’t quite trust the data, any intelligent person can clearly see that today the economy is a lot better off than in March 2009.
So, what happened the last time REITs were as unpopular as today?
The Last Time REITs Were This Unpopular
| Time Frame (Years) | REIT Annual Returns | REIT Total Returns | S&P 500 Annual Returns | S&P 500 Total Returns |
| 1 | 110% | 110% | 56% | 56% |
| 3 | 43% | 195% | 26% | 100% |
| 5 | 30% | 265% | 23% | 180% |
| 7 | 24% | 356% | 17% | 202% |
| 10 | 18% | 439% | 17% | 361% |
(Source: Portfolio Visualizer Premium.)
The last time REITs were this unpopular, they went on to deliver Buffett-like 18% annual returns for the next 10 years. More than 5X your money.
REIT Investing In A Rising-Rate Environment: Crazy Like A Fox
NAREIT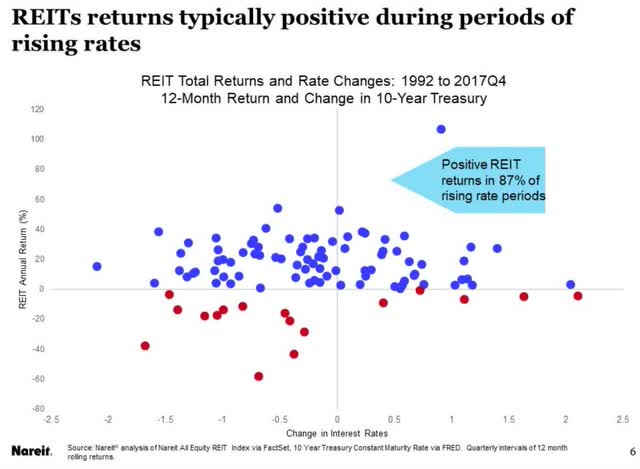
In 87% of periods, when rates are rising, REITs go up. Why? Because rates don’t go up in a bad economy. And when the economy grows, so are rents, cash flows, and dividends. You know, the things driving 97% of long-term stock returns.
“This time is different! It’s like the 1970s! Inflation Armageddon is coming!”
Daily Shot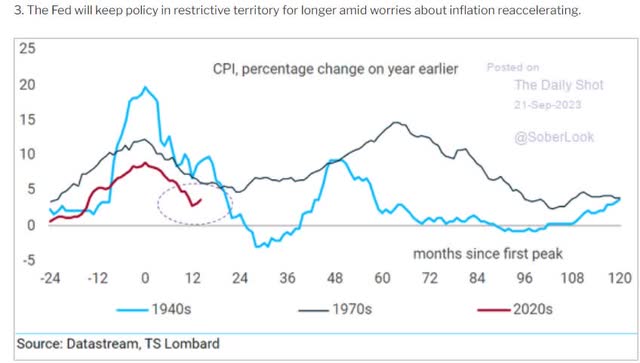
Yes, the last 2 times we had large inflation spikes, there ended up being 3 spikes.
- a sample size of 2 is hardly anything to panic over.
In the 1970s, the 2nd inflation spike was about 50% higher than the first. If that happened against this time, inflation might hit 14% by 2028.
The Fed would be forced to hike to 15% to 16%, and 10-year Treasury yields (US10Y) could go double-digits.
- credit card rates 30% (the legal limit)
- mortgage rates as high as 12%
- auto-loan rates of 18%.
Guess what REITs did in the 1970s? They must have been gored, right? Completely destroyed by the highest rates in history, including 16% 10-year yields, 20% Fed funds rates, and borrowing costs for some REITs of 25%.
| Year | Equity REIT Returns |
Average 10-Year Treasury Yield |
| 1972 | 8% | 6.2% |
| 1973 | -16% | 6.9% |
| 1974 | -21% | 7.6% |
| 1975 | 19% | 8.0% |
| 1976 | 48% | 7.6% |
| 1977 | 22% | 7.4% |
| 1978 | 10% | 8.4% |
| 1979 | 36% | 9.4% |
| 1980 | 24% | 11.4% |
| 1981 | 6% | 13.9% |
| 1982 | 22% | 13.0% |
| 1983 | 31% | 11.1% |
| 1984 | 21% | 12.5% |
| 1985 | 19% | 10.6% |
| 1986 | 19% | 7.7% |
| 1987 | -4% | 8.4% |
| 12 Year Period | 1061% | 9.4% |
(Source: NAREIT.)
During these 12 years, the S&P 500 (SP500), including dividends, was flat. A lost decade!
REITs were up almost 12X.
These “bond alternatives” didn’t trade like bonds at all. Because REITs are NOT bond alternatives and never have been.
Short term, anything can happen on Wall Street.
But here is the shocking truth about REITs and Interest Rates.
Everything You Think You Know About REITs And Interest Rates Is Wrong
NAREIT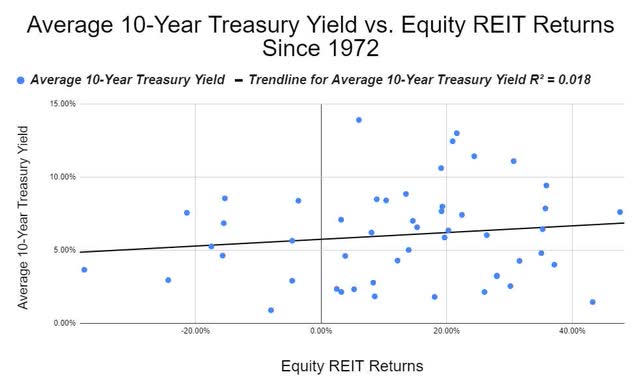
In the short term, REITs can be crushed by rates. But long term? The only time frame that matters for investors as opposed to speculators? What’s the correlation? 0.04.
In other words, for 50 years, had you known exactly what interest rates were going to do, with 100% accuracy, you could have predicted 1.8% of REIT returns.
And only if you thought higher rates helped REITs.
Remember REITs are the ultimate utility for the economy. Every business needs a roof over its head!
Real Estate is like farms; without them, the world as we know it can’t exist.
Why Now Is The Perfect Time To Be Buying REITs
REITs are down 30% right now. Guess where the average REIT bear market of the last 50 years bottoms?
Ycharts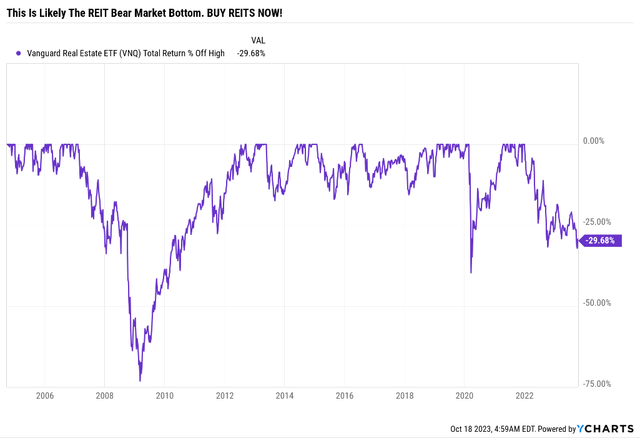
Historically Speaking, NOW Is The REIT Bear Market Bottom
| REIT Bear Market/Correction | Peak Decline |
| 1973 to 1974 | -34% |
| 1990 | -15% |
| 1998-1999 | -21% |
| 2007-2008 | -68% |
| 2013 | -14% |
| 2015 | -15% |
| 2016-2017 | -15% |
| Pandemic | -25% |
| 2022-2023 | -30% |
| Average | -26% |
| Median | -25% |
(Source: NAREIT)
Hear me now; quote me later. Easiest statistical call of the year. 80% likely that REITs are within 6% of bottom.
In other words, the data says there is an 80% chance that if you buy Vanguard Real Estate Index Fund ETF Shares (VNQ) today, it won’t fall more than 6% no matter how high rates soar, even if we get a recession next year. And the upside potential? About 340% over the next ten years. Risk 6% downside (temporarily) to maybe quadruple your money? That’s what we call a Buffett-style “fat pitch” opportunity.
How To Find The Best Buffett-Style REIT Aristocrat Bargains In 1 Minute
Here is how I have used our DK Zen Research Terminal to find the best 8% yielding blue chips to buy no matter what happens next with the economy.
From 504 stocks in our Master List to the best REIT aristocrats you can buy today.
All in one minute, thanks to the DK Zen Research Terminal. This is how I find all my investment ideas.
| Screening Criteria | Companies Remaining | % Of Master List | |
| 1 | Sector “REITS” | 53 | 10.60% |
| 2 | “Lists” and “Dividend champions” | 4 | 0.80% |
There are only 4 REIT aristocrats, and here they are.
My, Oh My, 4 Buffett-Style 5.4% Yielding Dividend Aristocrat Buys
Dividend Kings Zen Research Terminal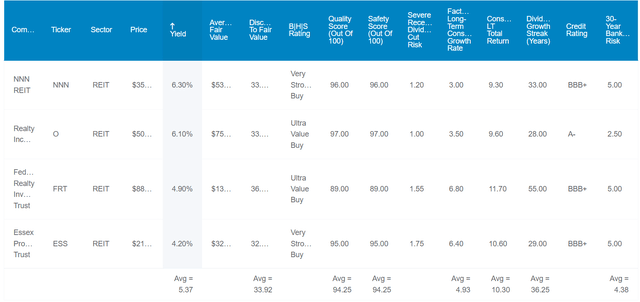
Would you rather buy cash, paying 5.5% for a year or two at best? Or lock in 5.4% on the four safest REITS on earth? And earn 2X the long-term return for decades to come?
The yield on cost will only go up at about 2X the long-term inflation rate. Even if inflation is 3% or 4%, your inflation-adjusted yield on cost will go up slowly. And if inflation is 5%? Then it will stay the same.
I’ve linked to articles exploring each REIT’s investment thesis. Here they are ranked by highest yield.
- NNN REIT (formerly National Retail Property) (NNN)
- Realty Income (O)
- Federal Realty Investment Trust (FRT)
- Essex Property Trust (ESS).
Fundamentals Summary
- yield: 5.4% (matching risk-free cash)
- dividend safety: 94% very safe (1.3% dividend cut risk)
- overall quality: 94% low-risk Ultra SWAN
- credit rating: BBB+ stable (4.4% 30-year bankruptcy risk)
- long-term growth consensus: 4.9%
- long-term total return potential: 10.3% vs 10.2% S&P 500
- discount to fair value: 34% discount (very strong buy) vs 10% overvaluation on S&P
- 10-year valuation boost: 4.2% annually
- 10-year consensus total return potential: 5.4% yield + 4.9% growth + 4.2% valuation boost = 14.5% vs 10.0% S&P
- 10-year consensus total return potential: = 287% vs 160% S&P 500.
5.4% very safe yield today and the potential to quadruple your money over ten years.
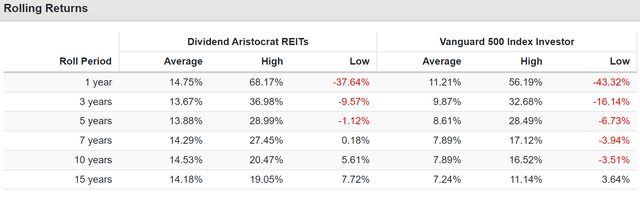
Historical Returns Since 1994
(Source: Portfolio Visualizer Premium) (Source: Portfolio Visualizer Premium) (Source: Portfolio Visualizer Premium)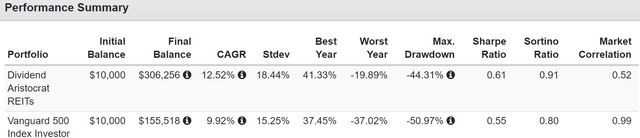
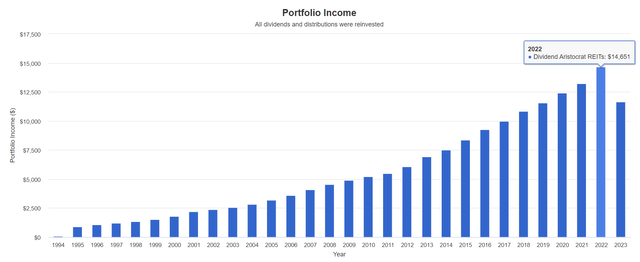
11% annual income growth for almost 30 years.
9% to 12% consensus growth range for the future.
Consensus Total Return Potential Through 2025
- if and only if each company grows as analysts expect
- and returns to historical market-determined fair value
- this is what you will make.
NNN REIT
FAST Graphs, FactSet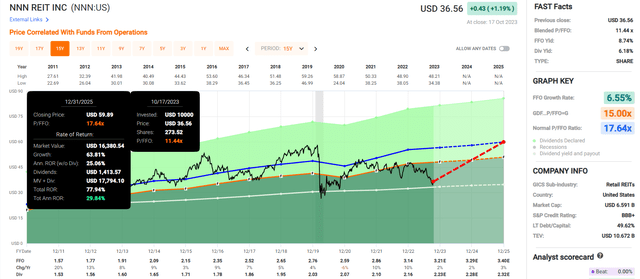
Realty Income
FAST Graphs, FactSet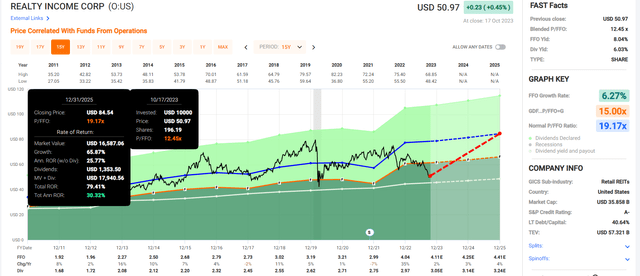
Federal Realty
FAST Graphs, FactSet
Essex Property
FAST Graphs, FactSet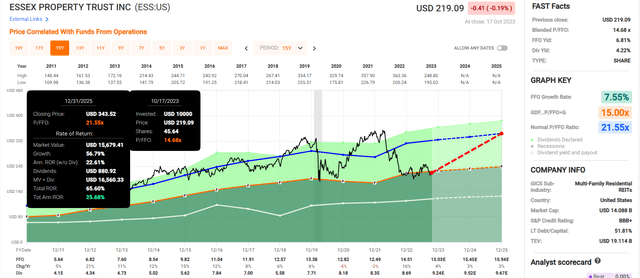
S&P 500
FAST Graphs, FactSet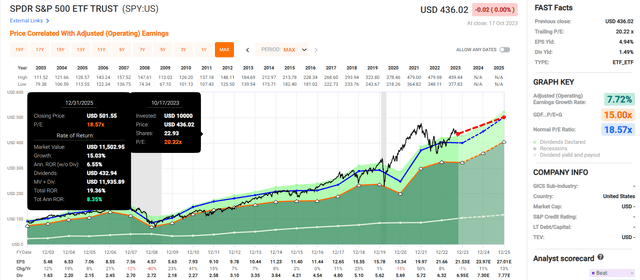
- S&P return potential 19% through 2025 or 8% per year
- REIT aristocrat’s return potential: 78% or 30% per year
- These aristocrat REITs offer 4X higher return potential through 2025 than the S&P.
Bottom Line: Run, Don’t Walk, To These 4 Buffett-Style “Fat Pitch” Dividend Aristocrat Buys
Let me repeat because I want to make this clear.
I very rarely make a table-pounding “this is the bottom” calls. I need to be 80% statistically certain that we’re close to the historical bottom to make such a call.
Hear me now; quote me later. Easiest statistical call of the year. 80% likely that REITs are within 6% of the bottom.
In other words, the data says there is an 80% chance that if you buy REITs today, they collectively won’t fall more than 6%, no matter how high rates soar, even if we get a recession next year. And the upside potential? About 340% over the next ten years.
And to help you sleep even sounder, buying high-yield aristocrat REITS like NNN, O, and Z is adding safety on top of valuation and the probability of massive gains in the coming years.
In the short term? The next few weeks? Even the next year? I can’t promise you anything. REITs might be at the bottom but trade flat for a while.
But what I can say with 80% confidence, the Templeton/Marks certainty limit on Wall Street for calls like these, which represents “I’ll die on this hill” confidence, is this.
No long-term investor in history has ever regretted buying REITs at these valuations.
And there is an 80% certainty that this won’t be the first time.
If you like REITs and aren’t buying them now, you’re doing it wrong and will regret it.
To paraphrase Casablanca:
If the REIT market leaves the ground and you have bought some blue-chip bargains you’ll regret it. Maybe not today. Maybe not tomorrow, but soon and for the rest of your life.”
Read the full article here