ASE Technology Holding (NYSE:ASX), the leading provider of OSAT services to the semiconductor industry, released its Q3 FY2023 report on October 26 and the market’s tepid response to the report was rather typical of how the stock has performed lately. The stock has essentially been on hold for months because it has been going sideways since late Q1/early Q2. The stock seems to be consolidating its prior moves by adopting a wait-and-see approach, but that may not last for much longer. Why will be covered next.
ASX has been on hold for months
A previous article from March rated ASX a hold even though the stock was in the midst of a powerful rally that had seen the stock gain as much as 73% in six months following the October 2022 low. The article theorized the stock was likely due for a breather and thus a correction after moving by as much as it had in the preceding months.
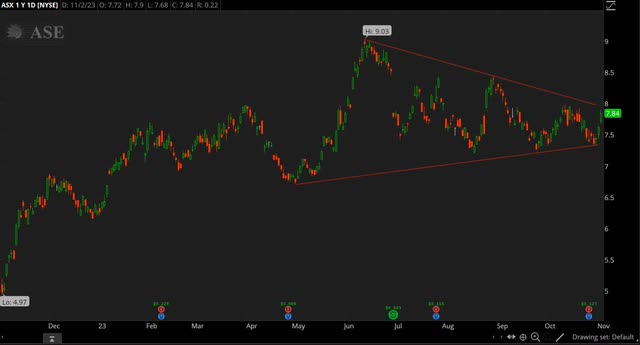
The chart below shows how the stock has not progressed much after the rally from earlier in the year came to an end. In fact, the stock is currently not far from where it was in March. The stock turned south as the prior article speculated it would, but the Q1 report in late April sent the stock soaring to a 2023 and 52-weeks high of $9.03 by June 13. However, the stock has been stuck in a holding pattern since then.
Source: Thinkorswim app
Notice how the highs are going down and the lows are going up. If trendlines are drawn, a pattern appears, which most closely resembles that of a symmetrical triangle, a holding pattern. This is consistent with a stock that has proceeded to consolidate its prior gains after doubling in value from the October 2022 low of $4.45 to the June 2023 high of $9.03.
Note also how the stock got down to the $7.20-7.30 region in August and September following the June high, only to turn higher both times. It’s therefore worth mentioning that the 38.2% Fibonacci retracement of the aforementioned move upwards, starting with the October 2022 low of $4.45 and ending with the June 2023 high of $9.03, is $7.28. This is within the $7.20-7.30 region and could be the reason why the stock has not gone lower as buyers may have settled on the $7.20-7.30 region and support may therefore be present within this region.
Still, the lower and upper trendlines are not far from converging, which suggests a breakthrough is likely in the near future. This breakthrough can occur in both directions, but up probably has the better odds, especially if support is in place as mentioned above. It’s also interesting to note how the stock fell after the Q3 report on the 26th, if only by 0.8%, which put it into contact with the lower ascending trendline.
Yet the stock did not fall below the trendline as the trendline held its ground. Now that the lower trendline has passed the challenge, it remains to be seen if the upper trendline does the same or whether it yields for a breakout. Either way, the stock has been going sideways for months, but this is likely coming to an end as the trendlines are close to converging.
Earnings have the wind in their favor at this time of the year
It’s also worth pointing out that ASX has seasonality in its favor at this time of the year, especially with many companies, particularly those in the smartphone space, releasing new products in time for the holiday shopping season. This could help the stock move higher in the coming months, especially if speculative interest takes part in anticipation of improved quarterly results.
Keep in mind earnings have gone down in recent quarters. EPS, for instance, has declined YoY for four consecutive quarters. On the other hand, EPS has improved QoQ with the last three quarters showing a sequential increase, although the presence of seasonality needs to be taken into account. Still, the improving numbers is likely to strengthen the belief the worst of the downturn has passed.
In Q3 FY2023, revenue declined by 18% YoY, but it also increased by 13% QoQ to NTD154.2B or $4.9B using a USD:NTD exchange rate of 1:31.45. EPS fell 49% YoY, but it increased by 14% QoQ to NTD2.00, which translates to NTD4.00 or $0.127 per ADS. EBITDA was NTD27,822M in Q3 FY2023, less than Q3 FY2022’s NTD38,601M, but more than Q2 FY2023’s NTD25,770M.
ASX managed to reduce interest-bearing debt on the balance sheet to NTD219.2B at the end of Q3 FY2023, partially offset by cash, cash equivalents and current financial assets of NTD71.9B. The table below shows the numbers for Q3 FY2023.
|
(Unit: NTD M, except EPS) |
|||||
|
Q3 FY2023 |
Q2 FY2023 |
Q3 FY2022 |
QoQ |
YoY |
|
|
Revenue |
154,167 |
136,275 |
188,626 |
13% |
(18%) |
|
Gross margin |
16.2% |
16.0% |
20.1% |
20bps |
(390bps) |
|
Operating margin |
7.4% |
6.9% |
12.6% |
50bps |
(520bps) |
|
Operating income |
11,405 |
9,412 |
23,683 |
21% |
(52%) |
|
Net income attributable to shareholders |
8,776 |
7,740 |
17,465 |
13% |
(50%) |
|
EPS |
2.00 |
1.76 |
3.92 |
14% |
(49%) |
Source: ASX
Management added some color to the most recent quarterly results. Demand remains soft, despite the boost from seasonality. From the Q3 earnings call:
“The overall environment for our businesses during the third quarter was relatively soft from an historical perspective. Devices related to new communications products introduced during the quarter generated a small pickup in demand, but, by and large, the post COVID inventory digestion and sub-optimal demand environment continued. For the third quarter, both our ATM and EMS businesses saw mild seasonal upticks.”
A transcript of the Q3 FY2023 earnings call can be found here.
On the other hand, ASX is cautiously optimistic about the near-term outlook. At the same time, ASX cautions there’s some uncertainty associated with the outlook.
“I certainly don’t have the crystal ball for it. I think the market is still very volatile. I think one good sign of it is really, same as everybody else, we believe that we’re at least at the — maybe at nearing the end of the inventory digestion.
But still I think that’s really not — at this point, I personally don’t believe that this is really the real issue here. I think the real issue is still whether the overall consumption will recover more in the stronger pace than what we were witnessing now. That really involves a lot of different — various exogenous factors. The recent war that’s going on in the Middle Eastern, it doesn’t help the situation.
And we thought that the inflation is in check now but with the war going on, that may have another — put in another variable into it. So it’s very hard to predict how soon or how fast the industry will recover. We’re just going to play by years. I think there are good signs, there are bad signs, but you know, overall, I think we’re just focusing on what we do best and serve our customers.
And we are cautiously optimistic about next year. We believe that going into Q1, over the — throughout the whole year of next year, we will continue to see year-over-year growth.”
The outlook calls for a return to YoY growth in Q1 FY2024. FY2024 is expected to be a year of expansion, which is in line with most industry forecasts for the coming year.
Consensus estimates are calling for ASX to earn $0.16 per ADS in Q4. ASX earned $0.34 in Q1-Q3, which suggests FY2023 EPADS will end up at $0.50. In comparison, ASX earned $0.90 in FY2022. FY2023 revenue is projected to be $18.15B, down from $21.83B in FY2022 or a decline of 16.9% YoY. This is several points more than the 13.3% YoY contraction some industry reports are forecasting for the OSAT market.
Why long ASX is worth taking into consideration
However, the OSAT market is expected to expand in the coming years. Some industry reports predict the OSAT market will grow at a CAGR of 8.1% in FY2023-2028. These forecasts are predicated on the expectation worldwide sales of semiconductors will return to growth in 2024, but it’s worth mentioning that semiconductor demand in general has been weaker than expected all year. If this continues, forecasts may need to be revised downwards.
Still, EPADS of $0.50 suggests next year’s dividend will be around $0.30-0.33, assuming ASX sticks to a payout ratio of 60-65% as in recent years. A dividend of $0.30-0.33 is much less than the last dividend of $0.56 paid out in August, but it still implies a dividend yield of between 3.8-4.2% with a stock price of $7.84. A 4% yield is very competitive in the tech space.
Multiples may also draw some to ASX. In general, ASX trades at lower multiples than most semis. For instance, EV/EBITDA is in the mid-single digits, well below the mid-teens for the median in the sector. The table below shows some of the more commonly referenced multiples used to judge stocks.
|
ASX |
Sector median |
|
|
Market cap |
$15.74B |
– |
|
Enterprise value |
$21.00B |
– |
|
Revenue (“ttm”) |
$18,556.7M |
– |
|
EBITDA |
$3,239.0M |
– |
|
Trailing non-GAAP P/E |
14.44 |
18.69 |
|
Forward non-GAAP P/E |
16.10 |
21.80 |
|
Trailing GAAP P/E |
13.93 |
24.02 |
|
Forward GAAP P/E |
16.14 |
24.81 |
|
PEG GAAP |
– |
– |
|
Price/sales |
0.84 |
2.52 |
|
Price/book |
1.71 |
2.58 |
|
EV/sales |
1.13 |
2.56 |
|
Trailing EV/EBITDA |
6.48 |
14.16 |
|
Forward EV/EBITDA |
6.90 |
13.53 |
Source: Seeking Alpha
There is also an argument to be made that ASX is trading well below fair value. Granted, fair value is highly subjective and it relies on making forward projections that may turn out to be way off in hindsight. Nonetheless, if we go by Peter Lynch, for example, and assume EPADS grows by 20.79% on average in the next five years, which is by how much earnings grew in FY2017-2022, and with TTM EPADS of $0.52, then an argument can be made that fair value for ASX is around $10.81-10.82.
Note that other methods suggest fair value could be even higher. If using a different method, like the discounted cash flow method for instance, and assuming free cash flow grows from NTD26B to NTD64B and with a discount rate of 6.6%, then it can be argued that fair value for ASX is around NTD418-419 or $13.30 per ADS. Either way, these different methods all suggest ASX at the current price of $7.84 is well below fair value.
Investor takeaways
ASX has a number of attributes in its favor. ASX pays a relatively high dividend and trades at multiples that do not break the bank. The OSAT market is expected to expand in the coming years, especially with advanced packaging attracting more and more interest in the industry. The balance sheet needs work, but nothing to really worry about. It depends on which method is used, but an argument can be made that ASX is trading below fair value.
However, while there’s a case to be made for long ASX, the reality is that long ASX has not returned much since the stock price is where it was in March, having traded sideways in the preceding months. On the other hand, the chart patterns suggest the recent sideways action in the stock is coming to an end. It can be argued that the recent consolidation in the stock was necessary following the rally from the October 2022 low to the June 2023 high, which resulted in a doubling in the price of the stock.
It’s possible the stock will break lower, but odds are the stock breaks higher out of the recent holding pattern. The stock would then resume the prior bullish trend, before the recent consolidation in the stock. Note how the stock seems to have found support, which favors a move to the upside. Still, while there’s a lot to be said in favor of long ASX, there is reason to doubt whether the recent downturn has run its course or whether it has ways to go.
ASX is optimistic growth will resume next year, but ASX also acknowledges demand remains soft and it is possible demand may regress. Demand has gotten a lift from seasonality recently and that has trickled though in an improvement in the quarterly numbers, but it is not impossible for the expected growth to disappoint once seasonality turns once more. There are many who are predicting an end to the current downturn, but some caution is warranted as semiconductor demand could continue to surprise by not coming in as expected.
With that said, I continue to hold ASX, but I would not be a buyer of ASX for the time being. The stock is most likely heading up in the near term, especially with seasonality in its favor and with ASX widely expected to return to YoY growth as soon as Q1 FY2024. But it would not be prudent to dismiss the possibility the market will end up disappointed as the slope of the rebound in demand may be a lot flatter than anticipated. If this happens, a return to the sideways action of recent months is not out of the question.
Read the full article here


Leave a Reply