It has been what I like to call a “buy everything” market in the last month. I, along with many other market watchers, expected a steeper pullback in US large caps following the high hit on March 28. Alas, it was a mere 6.1% retreat, using intraday prices, on the S&P 500. What’s more, equities usually feature volatility heading into the Memorial Day weekend during election years. But the bulls have been strong, with earnings numbers supporting higher stock prices.
Thus, I am upgrading the Vanguard S&P 500 ETF (NYSEARCA:VOO) from a hold to a buy. It’s a bit of a capitulation call, as I was neutral on the SPX during the middle of March, which turned out to be in advance of the late-Q1 interim peak.
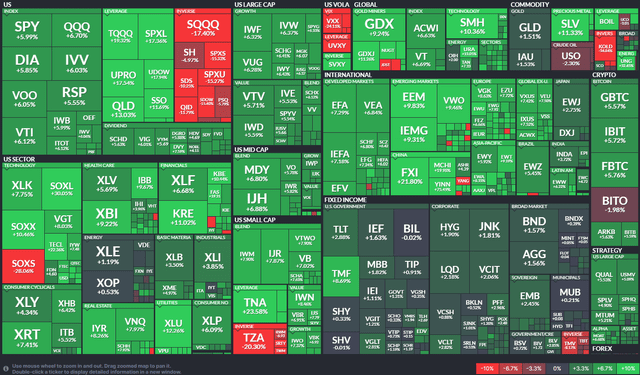
1-Month ETF Performance Heat Map: Broad-Based Gains, VOO +6%
Finviz
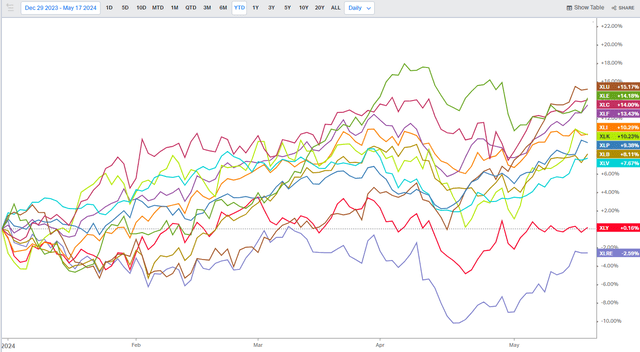
While the past month has been a boon for nearly all assets, from stocks to bonds to commodities to cryptocurrencies, the sector view of the S&P 500 shows a new leader. Utilities (XLU) holds the pole position, up by more than 15% since the start of the year.
Energy (XLE) and Communication Services (XLC) are hot on the power sector’s heels, but it really has been a broad set of gains. Just recently, the Information Technology sector (XLK) has reasserted itself as the place to be overweight. Overall, this participation profile is an encouraging sign as we make our way beyond the Q1 reporting period.
Year-to-Date S&P 500 Sector Returns
Koyfin Charts
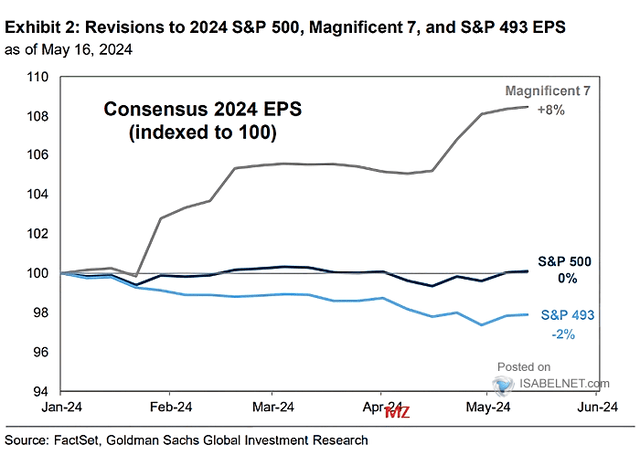
Speaking of earnings, the trailing view is all about big tech. The Magnificent 7 stocks continue to be the darlings of the sellside. Charted below, that group of equities has enjoyed an 8% EPS upward revision to FY 2024 numbers while the so-called “S&P 493” has actually seen its earnings estimates trimmed.
The result is an unchanged calendar-year operating EPS sum expected for the SPX – currently at $244 according to the latest numbers from Factset. The good news for value and cyclical investors is that the S&P 493, as well as small- and mid-cap stocks, are forecast to see much stronger year-on-year bottom-line growth over the back half of 2024.
Upward EPS Revisions to the Mag 7
Goldman Sachs
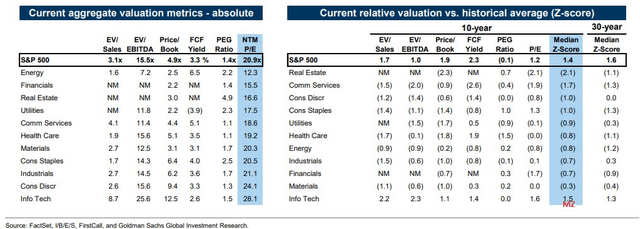
As it stands, the S&P 500 trades at nearly 21 times forward EPS estimates, according to David Kostin’s US Weekly Kickstart report put out last Friday afternoon. Utilities’ earnings multiple has climbed to 17.5 and Energy is the cheapest sector with just a 12.3x multiple and a significant buyback yield.
S&P 500 Sector Valuation Metrics
Goldman Sachs
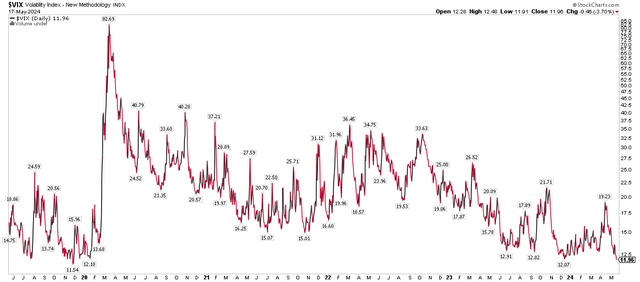
Amid constant action of sectors vying for the top YTD position, what is absent is volatility. The VIX settled last week at its lowest mark since November 2019, suggesting that VOO will likely see muted daily swings looking out the next 30 days.
But within that window will be the April PCE report on May 31, the May employment report on June 7, and May CPI hitting the wires during the next FOMC meeting. Beyond that, could volatility kick up around the proposed late-June presidential debate? It is something investors should mark on their calendars.
VIX Falls to Fresh Multi-Year Lows
Stockcharts.com
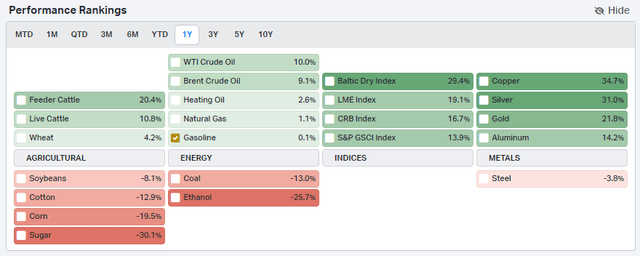
What’s helping VOO right now is not just the AI trade. Economically sensitive commodities are in full-blown bull-market mode. That’s also assisting Energy and Materials, as well as some Industrials-sector equities, though the XLI ETF has been a notable laggard lately.
So, while I have a buy rating on VOO, I encourage investors to consider price strength in many resource-rich markets like a host of emerging markets and other non-US developed markets.
1-Year Commodity Returns
Koyfin Charts
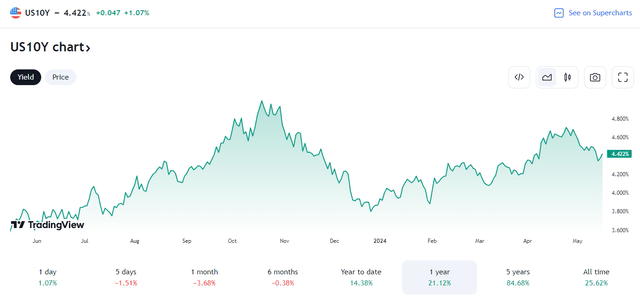
But a key tailwind helping all risk-on areas is the recent drop in US Treasury yields. The rate on the benchmark 10-year Treasury note sank from above 4.7% late last month to a fraction above 4.3% following the April CPI report last week.
Still, the yield seemed to find support at 4.3%, and you can see in the below graph that 4.3% is indeed an important spot on the chart. This is a potentially bearish feature – if we see a rebound in inflation fears, that would likely result in lower bond prices and a tough tape for VOO.
Lower Rates Provide a Boost to VOO
TradingView
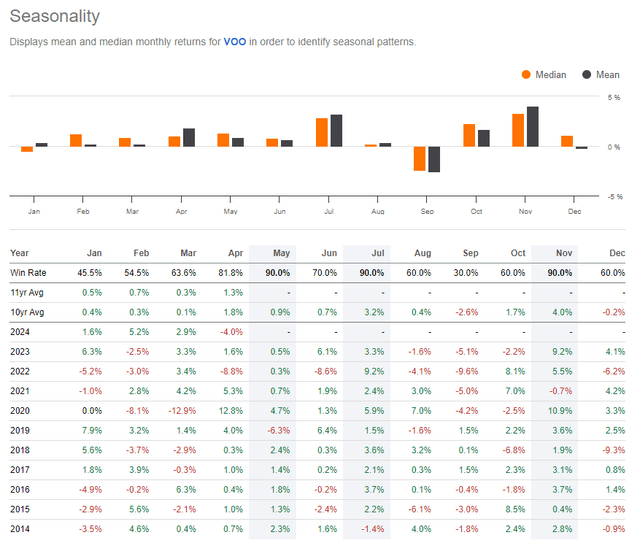
Seasonally, however, now is a bullish time for US large caps. Over the past 10 years, VOO has returns significantly positive through July, and I mentioned earlier that during election years, a bullish run has, on average, taken flight starting right after the long Memorial Day weekend.
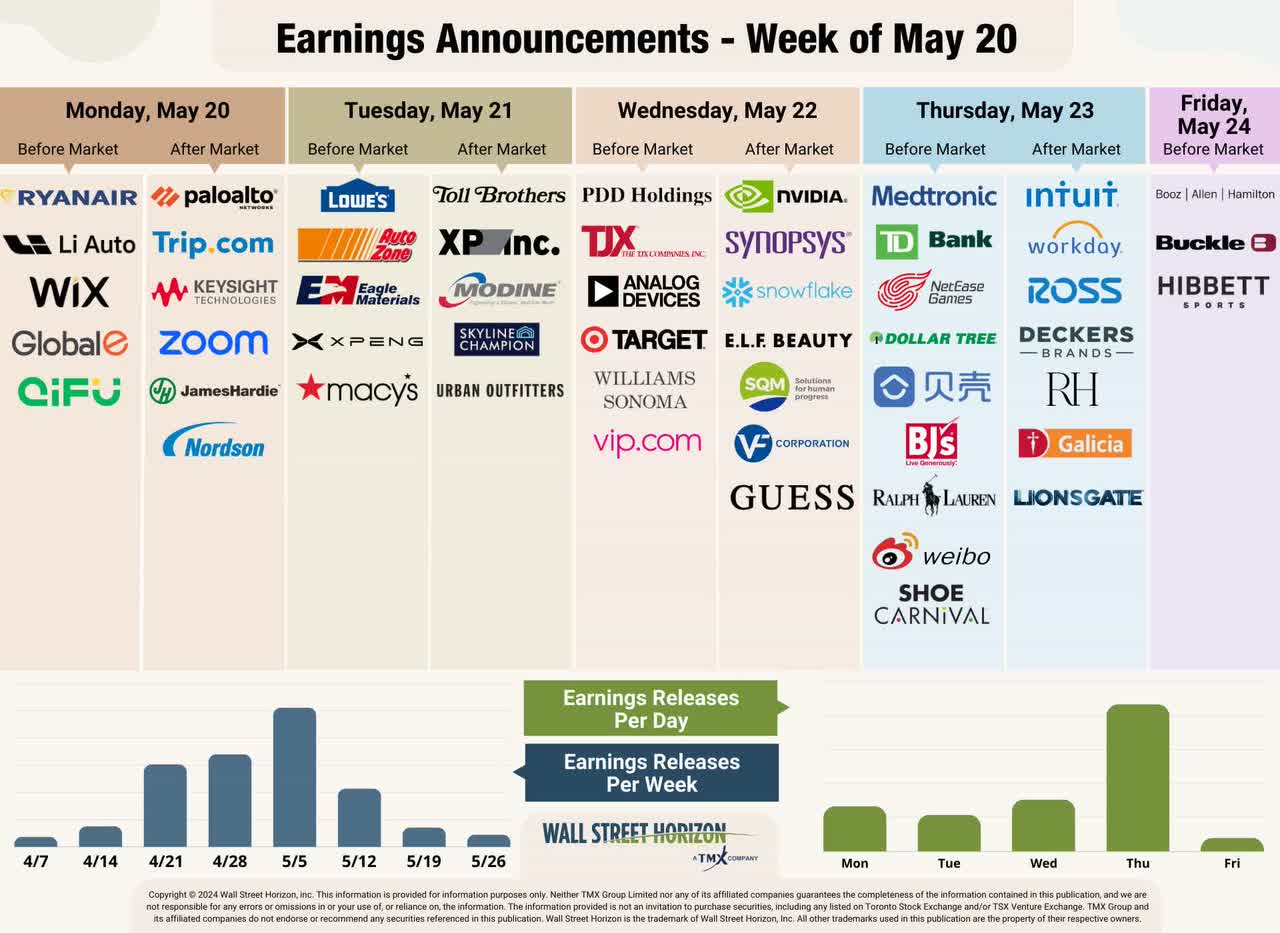
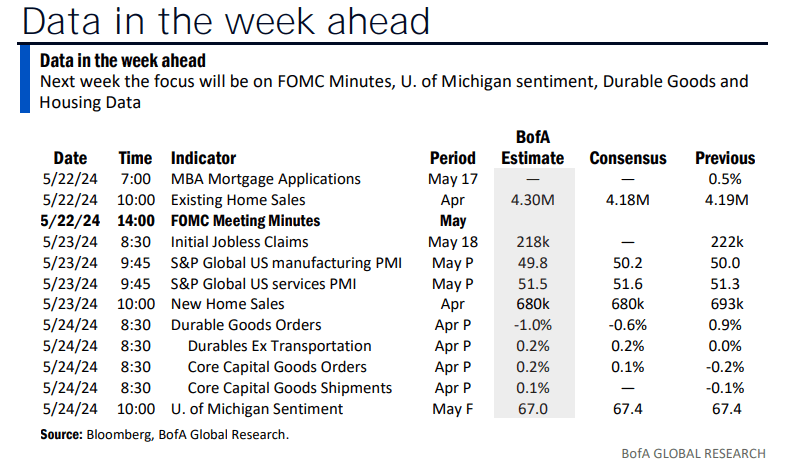
Looking ahead, the focus this week will be on NVIDIA’s (NVDA) Q1 earnings report along with profit reports from major US retailers.
Earnings Reports This Week
Wall Street Horizon
This Week’s Data Deck
BofA Global Research
VOO: Bullish Seasonal Stretch Through July
Seeking Alpha
The Technical Take
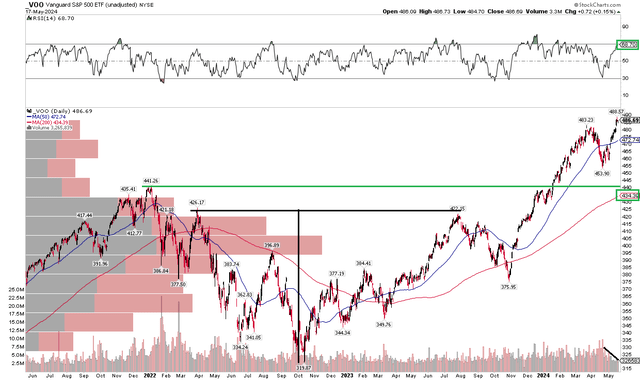
With an admittedly high earnings multiple, above 20, decent breadth, and positive seasonals, VOO’s technical chart looks strong in my view. Notice in the graph below that shares rose to record levels at the close of last week. The late-March through mid-April decline didn’t even threaten to test support at the previous high-water mark from late 2021 and early 2022, nor did it take a run at any of the key Fibonacci retracement levels. Furthermore, in a rare feat, all 11 S&P 500 sectors trade above both their respective 50-day and 200-day moving averages.
Also take a look at the rising 200-day moving average. It remains firmly upward-sloping, suggesting that the bulls are in control of the primary trend. What’s more, the RSI momentum gauge at the top of the chart has recovered to multi-week highs, just shy of technically “overbought” conditions. A risk, though, is that the latest upward thrust in VOO’s price comes amid remarkably low volume. I would like to see larger volume upward moves in the ETF price and pullbacks on low volume, so this is an indicator to monitor over the coming weeks.
In terms of upside targets, if we take the $105 height of the April 2022 to December 2023 range and add that onto the breakout point of $425, then perhaps $530 or so is doable over the months. For support, $454 and $441 are your downside bogeys on VOO.
Overall, the technical view on VOO is healthy as US large caps march to new record highs.
VOO: Bullish Upside Breakout and Successful Hold of Support, Stronger RSI
Stockcharts.com
The Bottom Line
I am upgrading VOO from a hold to a buy. The April dip was not much, but price action has been dominated by the bulls lately. While the fund’s P/E ratio is lofty, the rally this year has been broad-based and the technicals appear strong heading into the summer.
Read the full article here


Leave a Reply