EMB Overview
The iShares J.P. Morgan USD Emerging Markets Bond ETF (NASDAQ:EMB) is designed to give exposure to U.S. dollar-denominated bonds issued by emerging market countries. Investors based in the US tend to prefer the exposure in USD to reduce currency risk.
From the emerging market countries’ perspective, they see this as an opportunity to tap into such demand and will therefore base a lot of their issuance in U.S. dollar-denominated debt. These two factors contribute to this ETF being substantial in size, with net assets of above $14 billion according to the EMB website.
Whilst the thought of investing in emerging market debt may sound risky, this is somewhat mitigated by the extreme diversification of this ETF. As outlined in the EMB Product Brief, the one investment gives you exposure to over 50 sovereign entities, and over 600 bonds. Over half of this is exposure is to investment grade bonds. This mix this year has produced a portfolio yield to maturity generally above 7%.
The ETF pays a monthly distribution, and the largest country exposures were less than 6% at the end of March this year. At that time for example, there was circa 5 to 6% exposure to Saudi Arabia, Mexico, Turkey and Indonesia.
When considering where EMB sits in terms of the bonds’ universe, the below snapshot from the data at end of March this year is useful to keep in mind.
EMB product brief using Bloomberg yield data from March 31, 2024.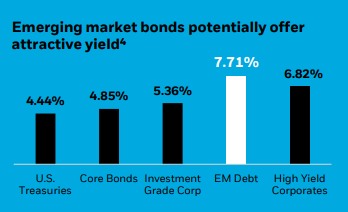
EMB fund facts
Other notable facts for this ETF are the average maturity of almost 12 years, and effective duration above 7. In obtaining such high yields you are therefore taking on some significant risk in terms of the sensitivity to interest rate changes.
Also, the drawdown observed in 2020 is worth noting in terms of risk when it comes to the market in a “risk-off” environment. I shall examine that in charts further down.
Fees for this ETF are a modest 39bps, compared with likely more than 1% for actively managed EM bond funds. Whether this is “cheap” though, comes down to a discussion on whether the active managers add any value after fees. I shall address this debate further down in this article.
EMB factsheet March 31, 2024.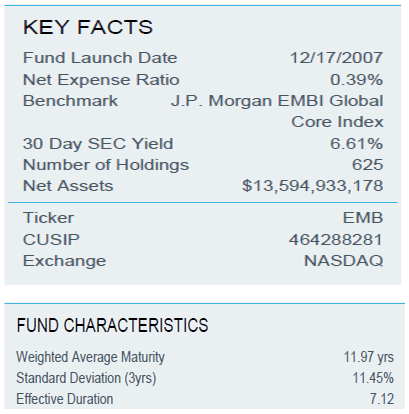
EMB performance history
Since inception (December 2007) performance numbers are listed in the table below:
EMB website, data as of May 31, 2024, inception date December 17th, 2007.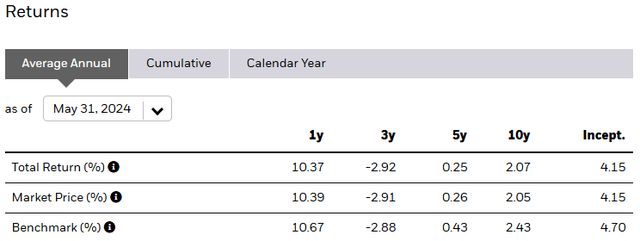
These performance numbers admittedly do not inspire much temptation to invest. In fairness though, it is over a timeframe that largely has faced a backdrop of what most would describe as a structural low yield environment for global bonds. This has only really changed in 2022.
With the current higher yields on offer in EM debt, and the improvement shown in performance in the last year, more of a case could be made to invest now. The global inflation scares of 2022 have somewhat moderated.
EMB peers’ analysis
In weighing up EMB versus some other similar funds to potentially consider, I thought it would be useful to examine the following.
EMB fund comparison, Seeking Alpha.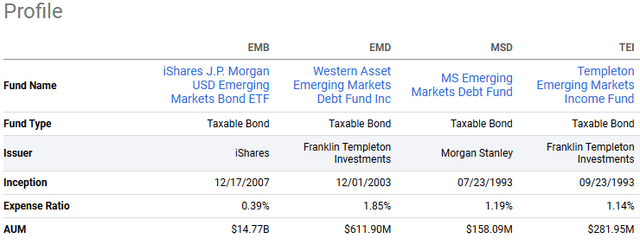
Whilst I realize there are 3 closed-end funds there and they do target higher yields, there are some reasons why one may consider such alternatives. They benchmark themselves on the J.P. Morgan USD EMBI Global Index but take on active investing risk, typically running portfolios with lower average credit ratings compared to EMB.
From that perspective, one would expect such CEFs would likely perform better over the longer term. In weighing up the alternatives we can also be mindful of the respective volatility shown in recent years.
5-year total returns to June 7, 2024, Seeking Alpha.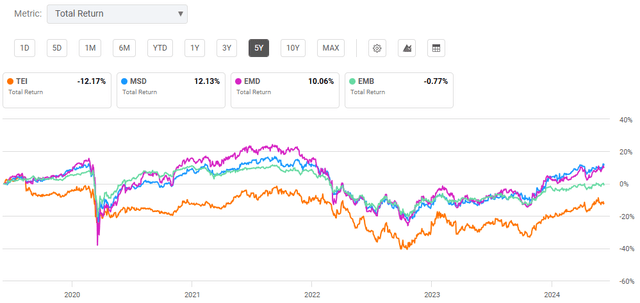
EMB has beat one of the CEFs above, but clearly lags compared with the other two over the last 5 years. As this shows total returns, it does incorporate some movement over the timeframe in the discounts to NAV for the CEFs. Such movements have been relatively modest though, so analyzing the performance above purely on NAV returns data would show a similar conclusion.
It does highlight that relying on an active manager can always be a bit of a hit and miss. It does offer food for thought though whether a passive product like EMB makes sense with this asset class.
Active versus passive management for emerging market debt?
CEFs such as the Templeton Emerging Markets Income Fund ETF (NYSE:TEI), the MS Emerging Markets Debt Fund ETF (NYSE:MSD) and the Western Asset Emerging Markets Debt Fund Inc (NYSE:EMD) have all regularly traded at double digit discounts to NAV in recent years. They charge clearly higher fees than EMB, but might be worthwhile if one subscribes to the theory that active management is preferred in EM.
Unsurprisingly, the above article is written by an active manager. There are nonetheless some good arguments favoring active over passive that are unique to EM debt. One therefore should not transfer any simple conclusions favoring passive, just because they might believe in using passive in US equities.
Referring to the study I linked to in the earlier paragraph above, I found the following table interesting. Even acknowledging that looking at the last 5 years is never a definitive guide to future performance; it still is worth being aware of. That is, in hindsight you were probably better off incurring the “expensive” active manager fees.
Morningstar direct study from October 2023 via ninetyone.com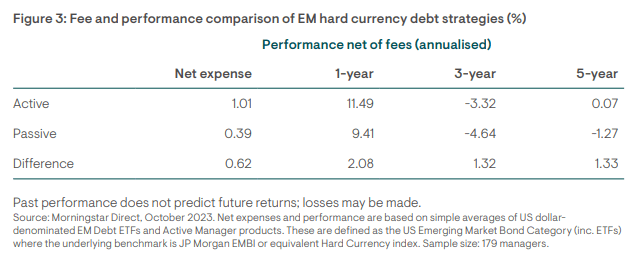
In terms of the CEFs I mentioned above, earlier this year I reviewed MSD which was my preferred pick in this area. EMD I would argue is not too far behind it though.
Emerging market sovereign spreads not all that attractive
Looking at some charts for the last decade, EM debt spreads have contracted considerably over the last couple of years.
AllianzGI, Bloomberg data as of 16 April 2024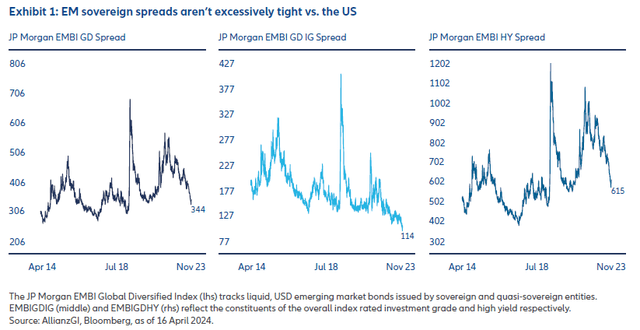
Whilst the spreads are described in the chart as not “excessively tight”, I do not view them as very attractive given they are still significantly tighter than seen in the last decade.
EM debt funds have continued their good performance even since mid-April, which is where the spread data on the charts above are updated for. With the potential risks ahead, now may be an opportune time to bank some of the strong gains in the last year here.
In the context of the last decade, a case could be made that risks are elevated for the global macroeconomic backdrop. Most economists expect similar steady global economic growth to continue next year, but the relatively tight EM debt spreads appear to be pricing in a “goldilocks” type economic environment. This is at a time where “sticky” inflation and elevated geopolitical risks still dominate the headlines.
EM bonds do offer high overall yields, but inflation is still high
Below are the three same EM bond indices decade long charts but displayed by yields instead.
Morningstar direct study from October 2023 via ninetyone.com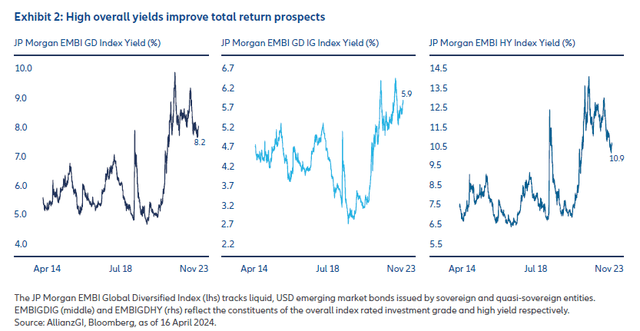
As I mentioned earlier, from a nominal return perspective, future return prospects look brighter than much of the last decade. That would want to be the case of course, given this ETF has only returned about 2% per annum in that time.
Even if EMB dramatically improves on the low returns over the last decade though, it still needs to beat what is likely to be higher inflation in the next decade. If inflation remains “sticky”, the higher yields on offer on EM debt may not be worth the risk.
According to the TD economics inflation tracker, the sticky inflation trend is also being observed in key emerging market economies. To quote TD, “ In major emerging markets, inflation has cooled substantially from its peak (Chart 9), however progress has slowed in recent months.”
National statistical agencies, TD economics, data from January 2021 to April 2024.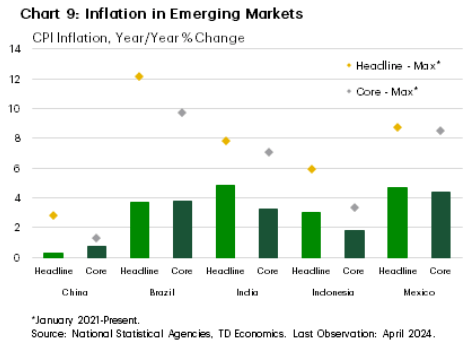
Will the upcoming Fed rate cut help EM bonds?
If you read the above question and are wondering why it is phrased like this is a certainty, well that is the point I am trying to make. There has been much discussion over the last year about choosing an investment to benefit from the upcoming Fed rate cuts. Yet at the same time we have continually seen such forecasted rate cuts being pushed out into future months.
EM bonds are an example of an asset class where many investors hope it will benefit from the Fed cutting rates, potentially leading to a weaker USD. On the other hand, a rising USD can be problematic for emerging market countries, as debt financed via USD becomes more expensive to repay.
A falling USD is often also correlated to improving risk appetite globally, an environment where EM debt spreads could be expected to tighten further.
With EM debt spreads already having tightened considerably in the last couple of years, it makes it a bit unnerving for holders of EMB to be hoping for USD weakness.
For those investors who do have conviction that the USD will weaken, they may also prefer to consider investing in local currency EM bonds. An example to gain exposure would be the iShares J.P. Morgan EM Local Currency Bond ETF (NYSEARCA:LEMB)
LEMB has underperformed EMB over the last year in a period where the USD has been more resilient than expected.
1-year total returns to June 7, 2024, Seeking Alpha.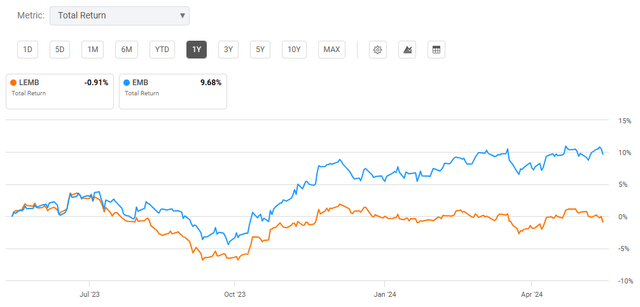
EMB top country exposures
EMB website, data as of June 6, 2024.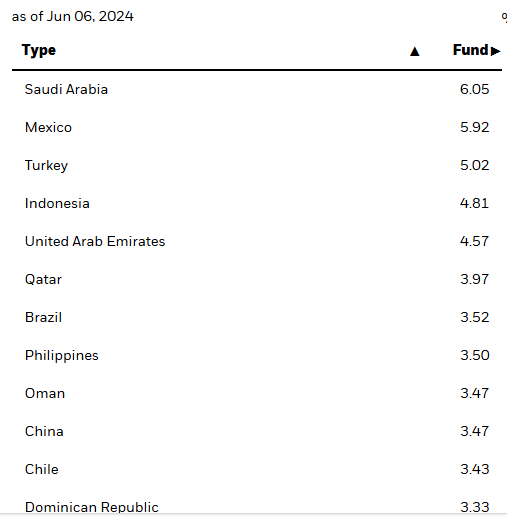
EMB sector allocations
EMB website, data as of June 6, 2024.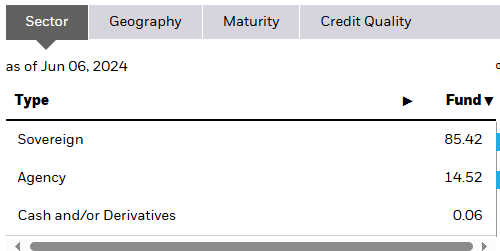
EMB exposures by credit rating
EMB factsheet, data as of March 31, 2024.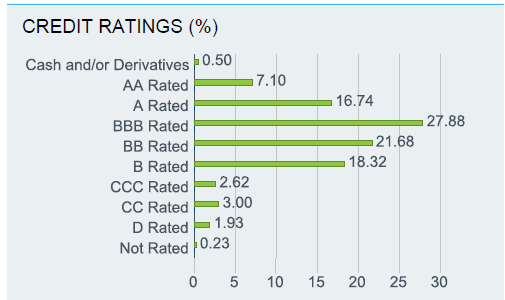
Conclusion
If I was looking for a fund to give me a relatively high monthly income, I would avoid EMB for the time being. EMB has finally put together some solid returns over the last year helped by contracting EM spreads, but now looks like the time for holders to take profits.
It is still unclear whether global central banks can fully wave goodbye to the inflation scares from 2022, and that includes within EM. The highly anticipated Fed rate cutting cycle that many investors also hope might boost sentiment to the likes of EMB is also looking increasingly uncertain.
Along with the uncertain geopolitical environment, recent weeks have also been a useful reminder of the unpredictability within EM politics.
For those preferring to maintain some core exposure to this asset class, the actively managed CEFs such as MSD or EMD are likely to produce better returns in the longer term.
Read the full article here





Leave a Reply