A critical mass of consumers acting in a price inelastic fashion could be a key source of inflation remaining stubbornly high. In this article, we will examine the factors that have likely led to inelastic consumer behavior and discuss why we believe this is starting to reverse. As price elasticity is restored, I anticipate inflation returning to a healthier 2% or lower.
We will begin by reviewing the economic concepts as to how price elasticity influences inflation, and follow with data suggesting a recent swell of price inelasticity. Finally, we will show data hinting that price elasticity is starting to come back and discuss the investment implications.
How a business sets its price of a good or service
There are 2 key points to consider:
- The revenue maximizing price
- The profit maximizing price.
Revenue for a given product is maximized at the point where marginal revenue of price increase equals zero. Consider this in the context of a normal demand curve.
2MC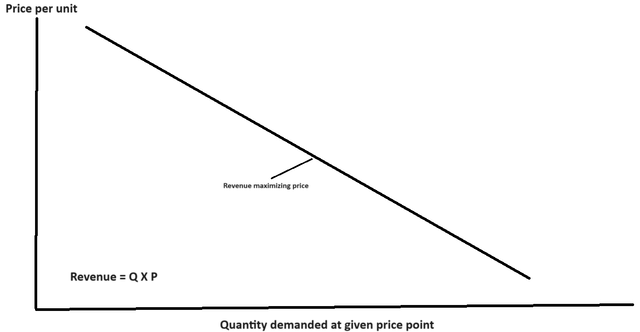
Revenue is the product of price (P) and quantity (Q) of units sold. Assuming normal elasticity, each increase in price results in a decrease in the quantity of units sold. So it becomes an area under curve calculation in which price increases up to a certain point will increase the product of Q times P. Beyond a certain point, the reduction in quantity sold hurts the product of Q times P more than the increase in price helps.
The revenue maximizing point is the minimum price a rational business could reasonably charge. In general, a business will care more about maximizing its profit than its revenue. To calculate the profit maximizing price point, the equation changes a bit. So rather than maximizing the product of Q and P, the business looks to maximize PQ – CQ with C being the cost of production.
Assuming a non-zero cost of production, the profit maximizing price will always be higher than the revenue maximizing price.
2MC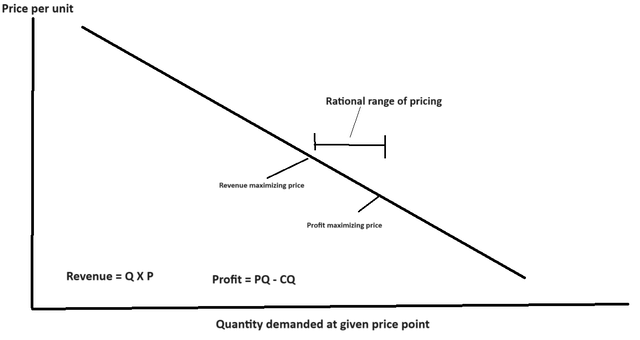
The equation could be simplified as maximizing the product of gross margin and quantity.
In normal circumstances, the drop-off in quantity demanded as price rises keeps prices in check. Through this mechanism, price elasticity helps battle inflation.
Recently, however, prices of certain goods and services have jumped as much as 20% to 50% depending on the category. Note that overall inflation was lower than these figures, as there were some categories that did not rise as much.
Some of the inflation was caused by supply disruptions of the pandemic, which shifted supply curves such that equilibrant pricing was higher. The supply disruptions have since corrected, so that is no longer the cause of persistent inflation. Another cause of inflation was likely the dramatic increase in money supply during and after the pandemic. This too has largely pulled back as the Fed is reducing its balance sheet and stimulus checks have stopped flowing.
I posit that the persistence of inflation beyond the temporary factors of 2021-2023 is a result of shifting consumer price elasticity. Specifically, a large cohort of consumers has been acting in a price inelastic fashion.
A price inelastic consumer cohort
Price elasticity is often viewed at a population level. Economists look at the overall demand for goods and services at various price points to ascertain the drop-off in demand as prices rise. It is measured by the steepness of the yield curve, with particularly steep curves representing inelastic demand.
The population level does not really capture the full story, as each individual consumer has their own elasticity. I might buy a good at $5 but pass at $6 while a different individual might buy it all the way up to $10.
There is a huge cohort of individuals with high disposable income and minimal required spending. A significant portion of young people have entered the workforce at high salaries. In the past, these salaries have gone toward buying homes and starting families, both of which have been materially delayed in young generations.
Birth rates have plummeted as Americans are having both fewer kids and having their first kid at a later age.
FRED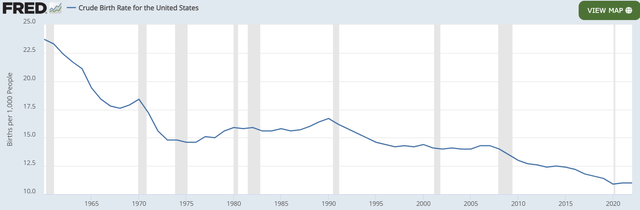
Without kids, there is less of an impetus to buy a home, resulting in the mediant age of first time homebuyers increasing by a whopping 6 years in the past few decades.
NAR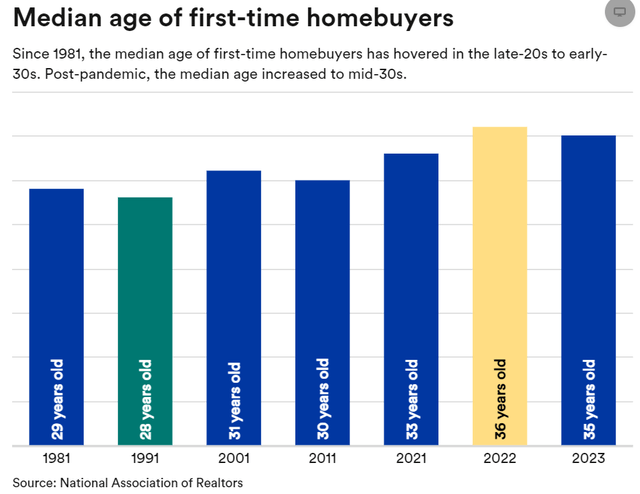
Data suggests that in addition to not buying homes, people aren’t even saving up money with which to buy a home in the future.
Personal savings rate has dropped materially to 3.6% as of April 2024 (most recent data point).
FRED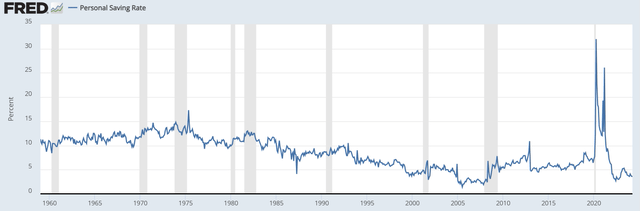
In aggregate, what this means is that there is a large chunk of the population with high disposable income and they are spending almost all of it.
An example of the type of person that is resulting in data moving in this direction would be a 30-year-old coder working 40 to 70 hours a week. With so much of their time consumed by work, they value convenience highly and are willing to spend what would have historically been considered egregious amounts of money to get a tasty dinner delivered. With limited time off, they want to get the most out of the time that they do get and perhaps travel, staying at a high-end resort.
Without kids or a house, they have the disposable income to afford this kind of lifestyle and even though they are not saving money it could still be viewed as financially responsible because they are building human capital through work experience and skill set development.
Anecdotally, the majority of my friends fit this description. I know anecdotal evidence is weak in an investment thesis, but the macro data also suggests similar behavior patterns given the low savings rate, high disposable income among young cohorts and substantial delay in starting families.
There have always been varying degrees of price elasticity in the population, but I think a critical mass has been reached which alters the revenue and profit maximizing price points for goods and services.
Critical mass of inelastic consumer behavior
As a certain percentage of consumers act in an inelastic fashion, there is significantly less drop-off in quantity of units demanded as price points rise. Effectively, this steepens the demand curve.
2MC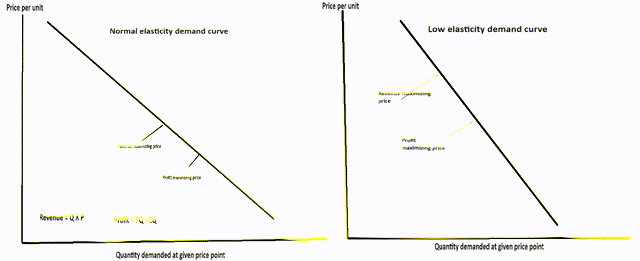
With the steeper curve, the revenue and profit maximizing prices are at a significantly higher price level. This change has contributed to sticky inflation.
Reasons to believe price elasticity is returning
Year-over-year changes are often impacted in a wave. For ease of illustration, consider a simplified scenario in which all first time home buying historically happened at age 32, but then it shifted to all first time home buying happening at age 33.
During the year in which the shift happened there would be no home buying, but in subsequent years the number of homes purchased would return to normal even if the home buying age stayed at 33.
In other words, the delays in home buying and having children will only continue to affect the overall numbers if the average age continues to rise. If it simply stays at the now higher number, birth rates and home buying will return to normal.
There have now been enough years since the shift in behavior patterns that the overall number of purchases/births will start to normalize.
With these additional sources of expenses, incomes will be spread thinner, thereby encouraging a return of price elasticity.
Additionally, pandemic related stimulus cash is starting to run out, so those who temporarily had higher disposable income are returning to their previous level.
Finally, financial strain on some portion of consumers is likely to force lower spending levels. Credit card debt inflected upward in 2022 and 2023.
FRED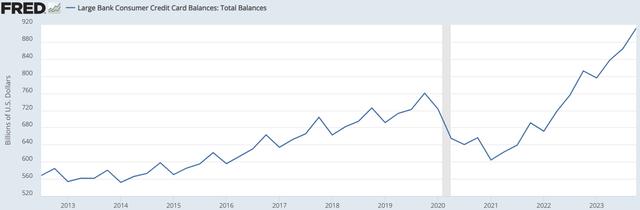
Delinquency rates remain below historical average, but have clearly risen with the now higher balances outstanding.
FRED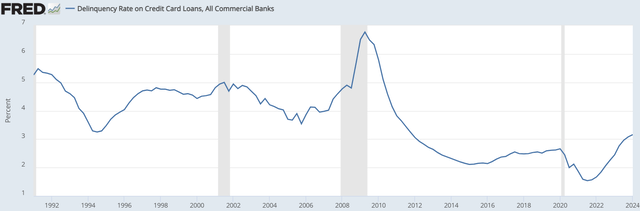
Perhaps consumers are starting to tighten their spending a bit, as recent data is encouraging.
The May CPI (consumer price index) suggests a significant slowing of inflation. In fact, the all goods category was at 0% month over month.
BLS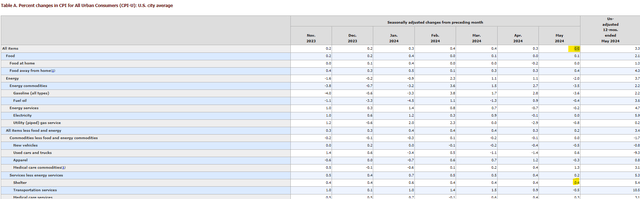
The primary reason the overall CPI headline number did not come in closer to the 2% Fed target is because shelter inflation remained quite high at 5.4% year over year.
Shelter, as measured by the CPI, is delayed by approximately 12 months. More real-time data coming from the apartment industry suggests rent inflation has already flattened to basically 0.
Yardi Matrix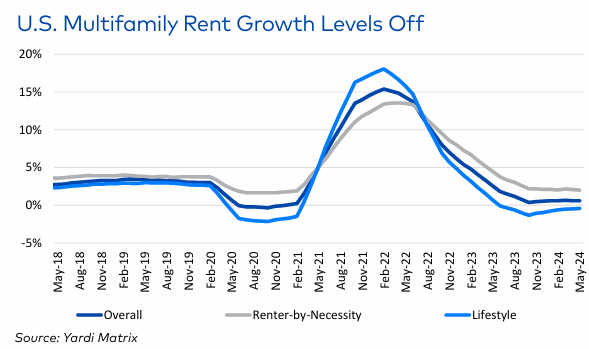
In fact, rent inflation has been around 0% for 5 months. It simply takes about a year to show up in the CPI number.
Consumer sentiment has also declined materially, dropping 5.1% month over month in the June 2024 read.
University of Michigan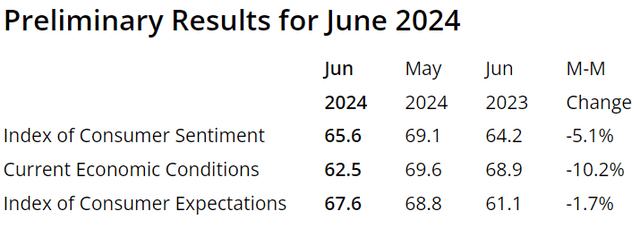
This takes consumer sentiment well below the norms of the last decade.
Trading Economics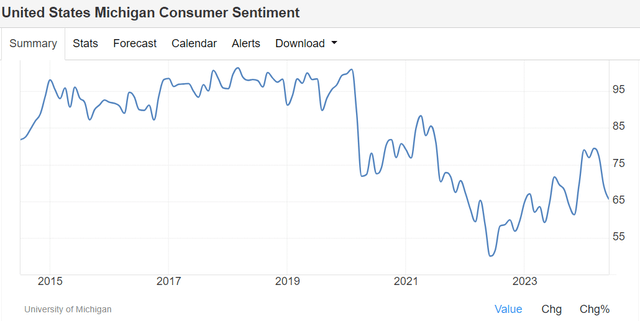
Overall outlook on inflation
Given the encouraging recent CPI data and the mechanisms which should be restoring consumer price elasticity, I think inflation is headed to a healthier lower level.
As this is what the Fed requires to start cutting rates, I think we are eventually headed to a lower rate environment. I don’t think there will be enough data by the July meeting for the Fed to feel comfortable cutting, but September is certainly in play.
In my opinion, this bodes well for stocks that have been beaten down by rising interest rates or fears of rates rising even further.
Read the full article here