There’s strong and growing evidence that the “next” US recession has begun – or will begin soon. Of course, many economists will remain unsure about it, having not forecasted it, or because they refuse to forecast, or because they don’t believe something’s real until it passes them by (perhaps not even then). Similarly tardy will be the National Bureau of Economic Research, but that’s by design because it assigns “official” dates to the start and finish of each recession and wants to be sure about the final status of oft-revised economic data before it makes its public pronouncements. Such “back-casting” and even “nowcasting” (offered by the New York Fed) are little help to those who prefer foresight and time to adjust before trouble begins.
Roughly a year ago, I reminded AIER readers that the US Treasury yield curve was inverted (i.e., the 10-year bond yield was lying below the 3-month bill rate), that all eight US recessions since 1968 were preceded (12-18 months) by such an inversion (with no false signals of recession arising without a prior inversion), and that another recession would likely begin in 2024. I wrote:
No better, more reliable forecaster of the US business cycle has existed in recent decades than the initial shape of the US Treasury yield curve, and since last October it’s been signaling another US recession that’s likely to begin in 2024. This is important, because recessions have been associated with bear markets in stocks and bull markets in bonds. Moreover, if a recession arrives early in 2024 it may affect the US elections in November.
The fact that the yield curve signal works so well for recessions is one thing, but why does it work so well? In September 2019, while forecasting the recession of 2020 (which was deepened but not caused by COVID-19 “lockdowns), I explained the logic in some detail to AIER readers:
First, a sharp decline in bond yields means a sharp rise in bond prices, which suggests a big demand for a safe security, reflecting a desire by investors to immunize against trouble ahead. Second, the longer the maturity at which one lends, the greater (normally) is the yield one receives (due to credit risk and/or inflation risk), so if bond yields are below bill yields it signals materially lower short-term yields in the future (i.e., Fed rate-cutting), which occurs during recessions. Third, the essence of financial intermediation is institutions “borrowing short (term) and lending long (term).” If longer-term yields are above shorter-term yields, as is the normal case, there’s a positive interest-rate margin, which means lending-investing is fundamentally profitable. If instead longer-term yields are below shorter-term yields, there’s a negative interest-rate margin and lending-investing becomes fundamentally unprofitable or is conducted (if at all) at a loss. When market analysts observe credit markets “seizing up” before (and during) recessions, it reflects this crucial aspect of financial intermediation.
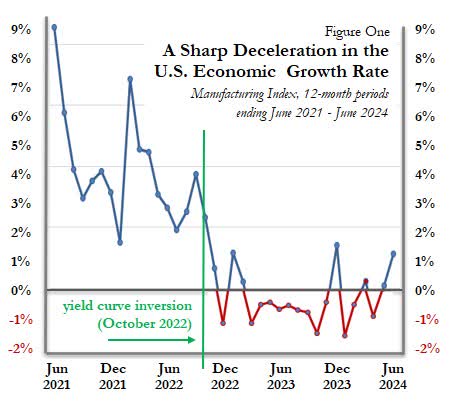
The recent, sharp deceleration in the growth rate of US manufacturing output is illustrated in Figure One, where I also indicate the point at which the latest yield curve inversion began: October 2022. That was twenty-one months ago, whereas since 1968 recessions have begun about ten months (average) after an initial inversion. If the next recession begins soon, it’ll come after a longer-than-usual lag, to be sure, but the lag prior to the “Great Recession” of 2007-09 was also long: 17 months. That it’s been inverted for so long, seemingly without negative results, could reasonably be construed as a bad thing. But negative results have been registered already: output growth has decelerated to zero (Figure One).

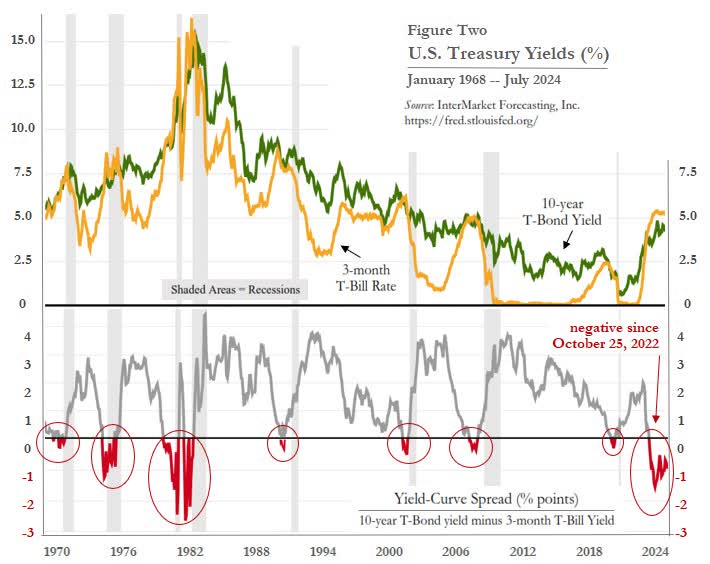
The graphical history of US Treasury bond and bill yields, the yield curve spread, and the eight recessions recorded since 1968, is given in Figure Two. In the lower panel, negative yield spreads (in red) entail yield curve inversions (bond yields below bill yields), which precede recessions (periods shaded in grey). The upper panel shows that yield curve inversions usually result from Fed rate hiking, allegedly to “fight inflation,” but in fact to fight, curb and if necessary, reverse the economy’s growth (which it falsely presumes causes inflation). The curve can also invert when the Fed keeps its short-term rate steady as the bond yield drops.

Figure Two shows that the most recent inversion has lasted longer and has gone deeper (a more negative spread) compared to all prior recessions except those of the early 1980s. Historically, the longer and deeper has been the initial inversion, the longer and deeper has been the subsequent recession. Sadly, this latest inversion is nearly “off the chart.” Moreover, it’ll likely persist for the balance of this year, as the Fed further delays (or minimizes) rate-cutting. As such, the recession could be relatively long, lasting well into 2025, perhaps even into 2026. The Great Recession lasted nineteen months; that same interval from here brings us to March 2026. The inordinately wide yield spread (deep into negative territory) also suggests that the magnitude of the coming output contraction could be larger than normal.
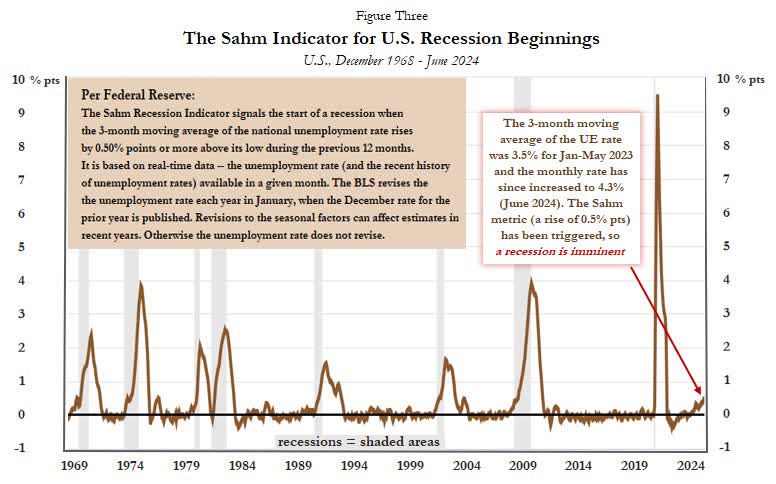
Although yield curve inversion provides an early and reliable signal of recession – with a lag time sufficient for people to immunize themselves and alter their spending habits, business plans, and investment portfolios – a shorter-term indicator is also available (and reliable). It is the Sahm Rule, which is based on the discovery (by Claudia Sahm) that recessions tend to begin soon after a specific uptick in the unemployment rate. It doesn’t take much – a jobless rate that’s at least 0.5 percent points above the previously low rate.
Figure Three plots the status of Sahm’s indicator since 1968. The recently reported US jobless rate was 4.3 percent (for June), which is more than 0.8 percent points above the previous low rate (from early 2023) of 3.5 percent. The Sahm threshold has been breached. This signal is effective because once the jobless rate rises by such a degree over a brief period, it rarely reverses. If indeed recession takes hold, the jobless rate keeps rising until after a recovery occurs.

Oddly, the yield curve signal alone didn’t convince many market professionals of pending economic trouble. So they’re surprised by dire economic data or equity price plunges; they don’t know the model – or know it but refuse to believe it. If the Sahm rule had been triggered without a prior curve inversion, perhaps they would have met that news with similar indifference. But the two measures together are significant and telling. First, we get the signal that another recession will arrive within 12-18 months, then we get the signal that says recession is imminent. The door knocks are getting harder and louder. Something’s out there.
Still, there is disbelief. It’s well known that employment levels lag other measures over the business cycle and don’t decline until after recessions begin. The fact that jobs are still being added this year may give some folks comfort, but perhaps it shouldn’t. Shifts in the composition of employment, however, do provide a key signal. Figure Three disaggregates US employment between the public sector and private sector. Recessions tend to occur after private sector job growth has decelerated and then dropped below the growth rate in government jobs. That’s been happening for the past half-year or so – yet another signal of a pending recession.
Why might this employment differential exhibit predictive power for the economy? Whereas private employers produce wealth and are profit maximizers, public employers largely consume wealth and are budget maximizers. The former are the essence of “the economy.” If the more productive sector is losing ground (and jobs) to the more parasitic sector, the real economy itself is also losing ground. Government is a burden on output, not its “stabilizer.”
Original Post
Editor’s Note: The summary bullets for this article were chosen by Seeking Alpha editors.
Read the full article here


Leave a Reply