August in review
Global physically-backed gold ETFs1 added US$2.1bn in August, extending their inflow streak to four months (Table 1, p2).2 All regions reported positive flows: Western funds once again contributed the lion’s share. The 3.6% rise in the gold price, paired with further inflows, lifted global assets under management (AUM) by 4.5% to another month-end peak of US$257bn.3 Collective holdings continued to rebound, increasing by 29t to reach 3,182t by the end of the month.
Thanks to non-stop inflows between May and August, global gold ETFs’ y-t-d losses further narrowed to US$1bn. The decline in holdings so far in 2024 has also been trimmed down to 44t. Meanwhile, the total AUM jumped by 20% during the first eight months of 2024. Y-t-d, Asia has attracted the largest inflows (+US$3.5bn) while Europe (-US$3.4bn) and North America (-US$1.5bn) lead outflows.
Regional overview
North America saw inflows two months in a row, adding US$1.4bn in August. Easing inflation readings, a cooling labour market, and dovish messages in both the Fed’s meeting minutes and Powell’s speech at the Jackson Hole symposium all cemented the deal for a cut from the Fed in September.4 As a result, the US 10-year Treasury yield and the dollar both experienced sharp declines in August. Lowering opportunity costs, among other factors, have led gold to another record high and fuelled gold ETF inflows. Meanwhile, the strong gold price performance led to exercises of in-the-money call options of major gold ETFs, creating sizable inflows at the expiry date.5 Additionally, rapidly escalating geopolitical tensions in the Middle East and the Russia–Ukraine conflict during the month, we believe, were another key contributor.
European funds attracted US$362mn in August, their fourth consecutive monthly inflow, albeit at a slower pace than previous months. Funds listed in Switzerland and the UK led inflows. Earlier in the month, fear stemming from headlines around the unwind of the popular “yen carry trade” resulted in a spike of volatility in global equity markets. This likely boosted safe-haven demand as gold ETFs concurrently saw increased inflows in the region. And prospects of further interest rate cuts from local central banks may have provided support – albeit they are expected to adopt a steadier and slower pace than the US Fed.6
Inflows related to FX hedging products were notable, especially in Switzerland, amid the strengthening local currencies against the dollar. And intensifying geopolitical risks were another key contributor to the region’s inflows.
Asian funds extended their inflow streak to 18 months. Nonetheless, the US$32mn addition is the smallest since May 2023. India once again led inflows in the region, marking the strongest month since April 2019, mainly driven by continued positive momentum from the budget announcement in July and the local gold price strength.7 Japan also saw notable inflows – for the sixth consecutive month – which might be related to amplified equity market volatility and lower Japanese government bond yields in August. In contrast, China led outflows, ending its eight-month inflow streak.
Funds in other regions recorded their third consecutive monthly inflow in August, totalling US$264mn, the largest ever. South Africa registered its strongest monthly inflow on record, likely boosted by plunging yields amid cooler-than-expected inflation, which has fuelled expectations for a domestic rate cut next month. Meanwhile, Australia has now recorded three consecutive months of inflows.
Gold ETF holdings and flows by region

Gold ETF flows
Demand captures changes in global/regional gold holdings; fund flows capture the net amount of money (in USD) that comes in or out of gold ETFs globally/regionally. See methodology note.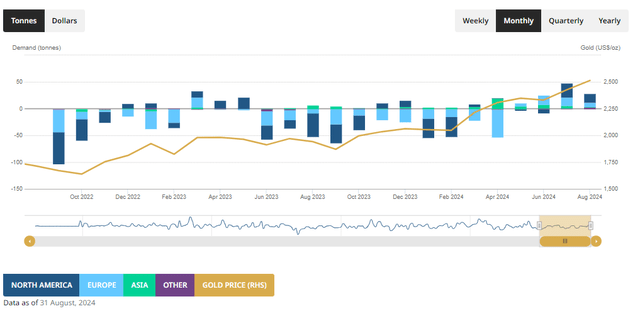
Trading volumes remain elevated
Global gold trading volumes slightly fell, reaching US$241bn/day in August, 3.2% lower m/m. Average trading volumes over-the-counter (OTC) rose further by 5.9% m/m to US$158bn/day. In tonnage terms, OTC volumes saw a 2% m/m increase. Exchange-traded activities cooled to US$80bn (-18% m/m), mainly due to a 28% m/m decline in COMEX volumes. In contrast, gold trading at the Shanghai Futures Exchange rose by 11% m/m. Global gold ETF trading volumes increased by 17% m/m – mainly contributed by North American funds (+20% m/m).
COMEX total net longs continued to rise, arriving at 917t by the end of August, a 17% m/m rise and the highest month-end level since February 2020. Increasing net longs were mainly contributed by money managers – their net positions reached 737t as of August, 25% higher than the end-July level and 71% above the H1 average of 430t. Similar to previous months, gold’s eye-catching performance and investors’ rising bets on the Fed’s future rate cuts were main drivers.
Gold ETFs holdings and flows
By region
Month ending 31 August, 2024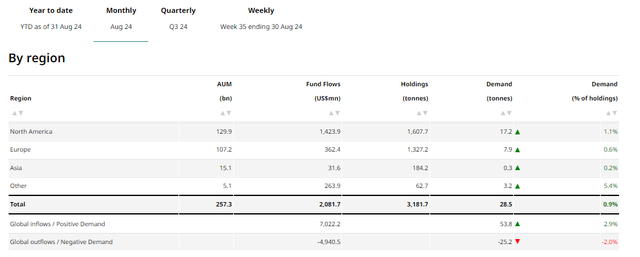
By country
Month ending 31 August, 2024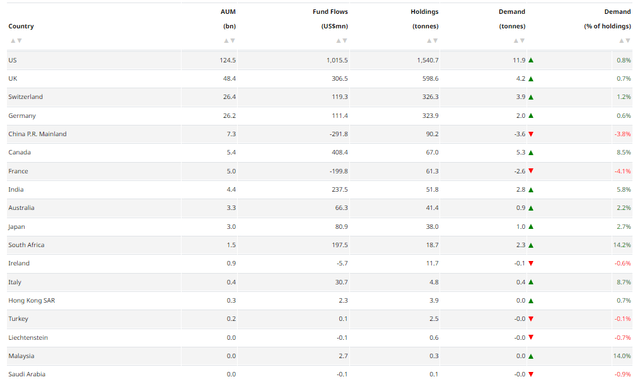
Top 10 fund flows
Month ending 31 August, 2024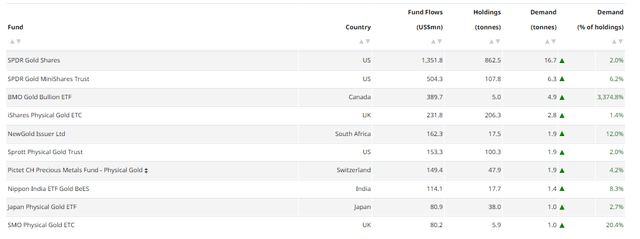
Bottom 10 fund flows
Month ending 31 August, 2024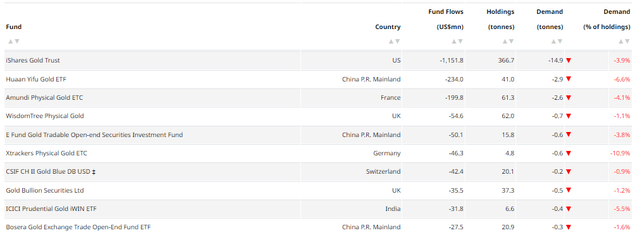
*We monitor how fund assets change through time by looking at two key metrics: demand and fund flows.
-
Gold ETF demand is the change in gold holdings during a given period. We use this metric to calculate the quarterly demand estimates reported in Gold Demand Trends.
-
Fund flows represent the amount of money – reported in US dollars – that investors have put into (or retrieved from) a fund during a given period. For more details, see our methodology note.
† ‘Global Inflows/positive demand’ refers to the sum of changes of all funds that saw a net increase in holdings over a given period (e.g., month, quarter, etc.). Conversely, ‘global outflows/negative demand’ aggregates changes from funds that saw holdings decline over the same period.
Gold ETFs holdings
Data as of 31 August, 2024 Sources: Bloomberg, Company Filings, ICE Benchmark Administration, World Gold Council; Disclaimer See methodology note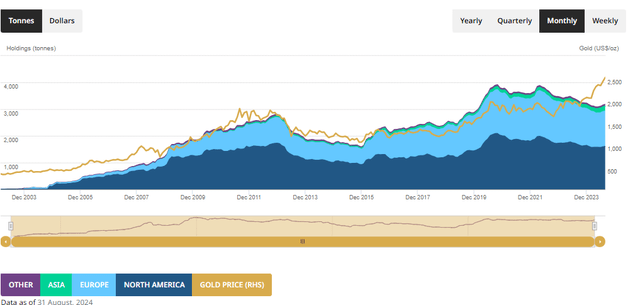
Footnotes
-
We define gold ETFs as regulated securities that hold gold in physical form. These include open-ended funds traded on regulated exchanges and other regulated products such as closed-end funds and mutual funds. A complete list is included in the gold ETF section of Goldhub.com.
-
We track gold ETF assets in two ways: the quantity of gold they hold, generally measured in tonnes, and the equivalent value of those holdings in US dollars (AUM). We also monitor how these fund assets change through time by looking at two key metrics: demand and fund flows. For more details, see our ETF methodology note.
-
Based on the LBMA Gold Price PM.
-
See: Fed Minutes Showed Officials Discussed July Rate Cut, Ready to Cut in September (msn.com); and Jackson Hole highlights: Powell’s cutting rates, Bailey’s lifting weights (msn.com)
-
Options expiry: While many ETFs have weekly or end-of-month option expirations, we refer to regular monthly expiration of ETF options that occur on the third Friday of each month, which generally have the most significant open interest. When gold prices rally into a major options expiration, it often elicits additional call options to be exercised, creating primary activity in the ETFs.
-
See: UK inflation, July 2024 (cnbc.com); and ECB minutes highlight openness to September interest rate cut (ft.com).
-
Please note that we have made a revision to Indian gold ETF data, for the updated version see: Gold ETF: Stock, Holdings and Flows | World Gold Council. Also note that flows data only date back to April 2019 due to data availability of Association of Mutual Funds in India.
Original Post
Editor’s Note: The summary bullets for this article were chosen by Seeking Alpha editors.
Read the full article here


Leave a Reply