Rexford Industrial (NYSE:REXR) is a unique industrial REIT concentrating its portfolio 100% on Infill Southern California. As of July 16, 2024, the Company owned 422 properties comprising ~49.7m sq. ft. of leasable area shared with over 1600 customers.
Its diversified property portfolio attracts strong tenants operating within various niches. The key areas of its properties address warehousing/transportation, wholesale trade, and manufacturing.
REXR’s Investor Presentation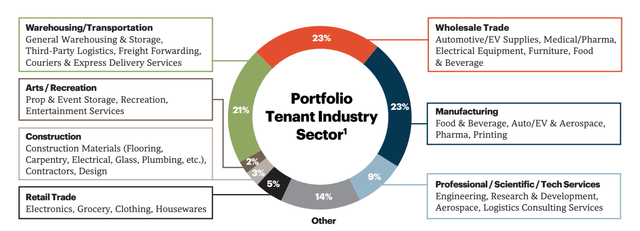
What’s Unique About REXR? The Market Outlook
Some context – oversupply headwinds industrial REITs face
For some context, the industrial real estate market has been facing some oversupply headwinds since mid-2022, resulting from cooling demand and substantial new supply hitting the market. The situation differs from state to state but can generally be considered as ongoing.
For instance, new supply exceeded 100m sq. ft. for the eighth consecutive quarter. At the same time, despite an increase quarter-to-quarter, demand remained modest, and 30m sq. ft. of net absorption was recorded in Q2 2024.
The negative supply-to-demand relationship drove the market vacancy rate to a new high in recent years, amounting to 6.5%, reducing landlords’ negotiating positions (reflected in lower occupancy rates and decreasing asking rent growth).
CoStar Inc. and Wells Fargo Economics
CoStar Inc. and Wells Fargo Economics
REXR is uniquely positioned – 100% SoCal Infill portfolio
The Company concentrates in one of the largest industrial markets, constantly recording high demand and low supply, leading to a favourable environment for landlords and healthy occupancy. As mentioned earlier, the supply-to-demand relationship is different from state to state, so the 100% concentration on a specific area may constitute a risk factor should that region experience negative market conditions; however, REXR’s market has typically performed well.
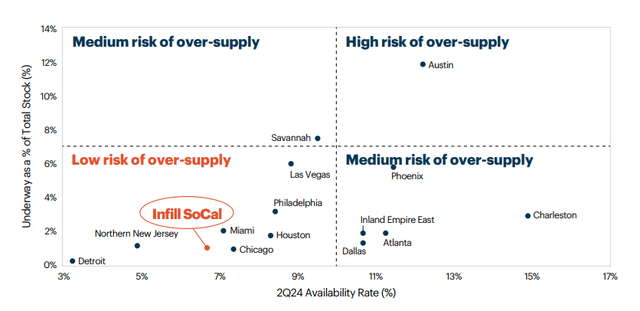
REXR’s target market is accompanied by a low oversupply risk due to its:
- high development barriers due to deficient developable land
- limited new supply hitting the market
- supply contraction due to the conversion of industrial real estate for other purposes
REXR’s Investor Presentation REXR’s Investor Presentation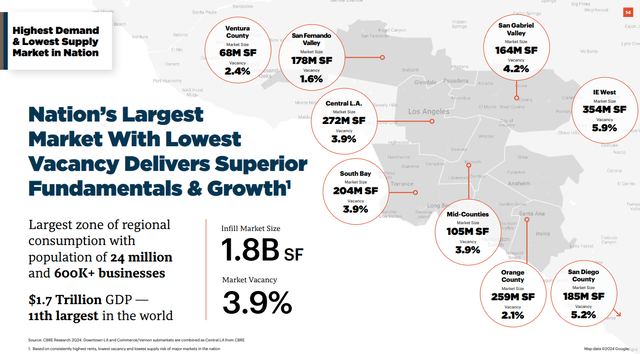
While the Company’s Total Portfolio recorded a 93.7% occupancy rate (modest level), REXR also distinguished the Same Property Portfolio to eliminate changes resulting from non-ongoing business (acquisitions, dispositions, etc.). The occupancy rate for its Same Property Portfolio amounted to a solid 97.3%.
Moreover, there are signs of the upcoming market improvement
As we all know, investing is not just about the present metrics, valuations, and market circumstances. It’s crucial to factor in the future expectations regarding the development of the analysed business and the market it operates within.
Earlier, I’ve highlighted just the negative conclusions resulting from the latest market data, but there are also some positives to consider. For instance, the net absorption I mentioned earlier recorded the first quarter-to-quarter increase in seven quarters.
What’s even more important – the state of the industrial space construction. Many markets are battling the oversupply of industrial space due to the significant supply hitting the market each quarter. That ‘new supply’ results from construction projects started quarters/years back.
With that said, the industrial space under construction has been gradually shrinking for the last couple of quarters, meaning that the construction finished is not replaced by new construction starts. That’s a valuable insight suggesting that future quarters/years will not be accompanied by such a substantial construction finished, leading to an improved supply-to-demand relationship.
CoStar Inc. and Wells Fargo Economics
Other Key Considerations
Lease expiration schedule and potential for rent bumps
During the Q2 2024, REXR achieved 49% cash-basis rent bumps. Some of you may wonder how such a substantial growth occurs. Let me explain. Lease contracts often include contractual rent escalators, typically amounting to low single digits annually. On the other hand, the last couple of years delivered substantial rent growth for industrial space.
Therefore, as REXRs’ leases expire, the Company can raise its rent through marking-to-market. That’s why a relatively low weighted average lease term often occurring in industrial REITs can be considered a double-edged sword. On the one hand, it provides less cash flow predictability and can occupy the team with intensive periods of negotiations, but on the other hand, it gives REITs the opportunity to adjust their rents more frequently.
REXR’s Q2 2024 10-Q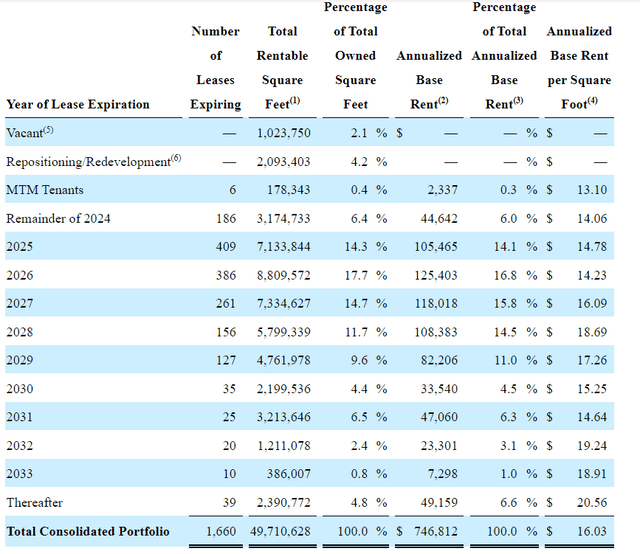
Robust financial performance
REXR’s Investor Presentation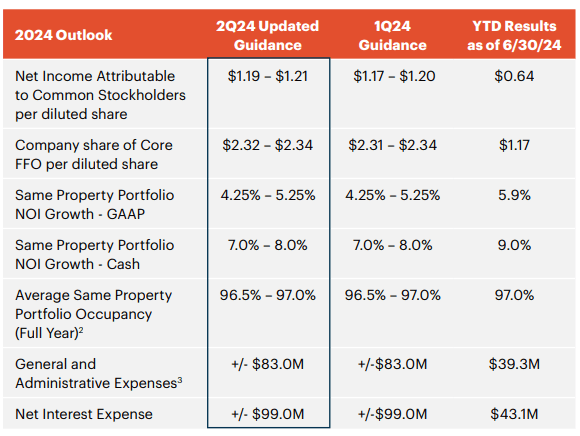
With its Q2 2024 results, REXR updated its 2024 guidance. That update was positive, leaving most key positions intact while driving the net income and Core FFO per share upward. The target range for the Core FFO per share amounting to $2.32 – $2.34 constitutes a 6-7% expected y/o/y growth (6.5% at the midpoint.
REXR still has substantial growth opportunities, and its portfolio growth has been dynamic (~22% annually since IPO).
REXR’s Investor Presentation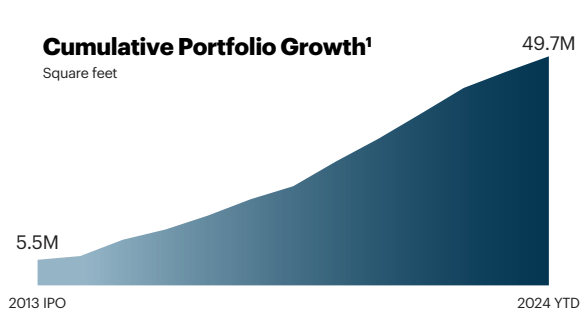
Moreover, the last 5 years brought outperformance of REXR compared to some of its peers (well-chosen by REXR). The Company recorded a substantially higher CAGR of:
- FFO per share
- Consolidated NOI
- DPS
REXR’s Investor Presentation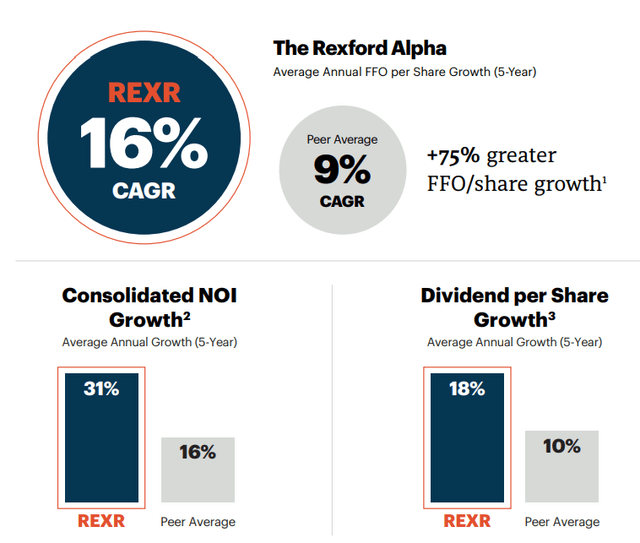
‘Sleep sound’ financing structure
REXR financing structure showcases:
- reasonably laddered debt maturity schedule
- 100% fixed-rated debt structure
- relatively short term, but in line with its peers, debt maturity term
- BBB+ credit rating
- 23% of debt in the financing structure
- 4.6x net debt to adj. EBITDA
For reference, please review the selected credit metrics of REXR and some of its peers.
Author based on REXR, PLD, STAG, TRNO, and FR
Given the relatively low impact of the high interest rate environment on REXR’s financial performance, investors may rest assured. The Company’s debt is 100% fixed-rated, and it will have relatively low debt maturities in the coming years. One factor to consider is the somewhat elevated AFFO payout ratio, which is slightly above the level I’d like to see, standing at ~88% on a forward-looking basis.
REXR’s Investor Presentation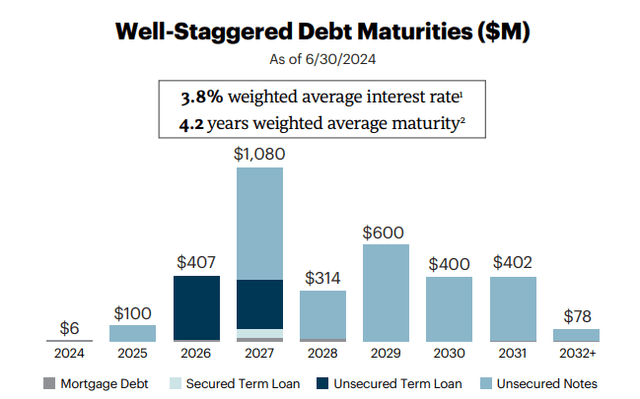
On Top Of That – REXR Has Multiple Expansion Potential
As an M&A advisor, I usually rely on a multiple valuation method that is a leading tool in transaction processes, as it allows for accessible and market-driven benchmarking.
The forward-looking P/FFO multiple stood at:
- 21.0x for REXR
- 16.4x for STAG Industrial (STAG)
- 24.1x for Prologis (PLD)
- 21.2x for First Industrial Realty (FR)
- 28.4x for Terreno Realty (TRNO)
- 23.7x for Americold (COLD)
- 22.2x for EastGroup Properties (EGP)
I have no reason not to like REXR. The Company showcases a unique investment strategy, safe financing structure, strong negotiating position within attractive markets from the supply-to-demand relationship standpoint, and a history of outperforming some of its peers.
Despite that, its P/FFO multiple is below most of its peers. Therefore, I consider REXR undervalued and expect its multiple to expand into the 22-23x range (in a conservative scenario).
Investment Thesis and Risk Factors
For transparency, I’ve recently established my first position in REXR, as I believe that it’s one of the top picks in the industrial space. Apart from REXR, I own PLD and FR.
Each stock market investment is accompanied by market and company-specific risk factors, which in the case of REXR include:
- uncertainty regarding the interest rate environment
- uncertainty regarding the sector-wide oversupply headwinds
- high geographical portfolio concentration
- somewhat elevated AFFO payout ratio
Nevertheless, I believe that REXR will benefit its shareholders greatly in the long term, as the Company provides a clear pathway to double-digit total returns resulting from:
- further dynamic FFO per share growth through its investment activity and significant rent bumps upon lease expirations
- attractive (across its peers) dividend yield, recording outstanding growth
- potential for multiple expansion
Therefore, REXR is a ‘strong buy’ for me. I took my own advice, and I am bullish on Rexford Industrial. Thank you!
Read the full article here


Leave a Reply