Research Summary
Today I’ll be rating American Express (NYSE:AXP), in the financials sector, consumer finance subsector.
For readers less familiar with this company, here are a few relevant points from their website that I think could be interesting to readers: trades on the NYSE, roots go back to 1850, based in NYC, in the business of payment products & services for consumers & businesses globally.
Two key peers of this company, according to Seeking Alpha data, are Capital One Financial (COF) and Discover Financial (DFS), which are two other stocks I also covered this year.
Wikipedia listed it at #16 on its list of largest banks in the US.
It had its FY2023 Q2 earnings results on July 21st, and we will dive into some of that data in today’s analysis, along with data provided by Seeking Alpha.
Rating Methodology
Using a streamlined, structured process, I break down my overall holistic rating of this stock into 5 categories I rank individually and of equal weight: dividends, valuation, share price, earnings growth, company financial health.
If I recommend this stock on at least 3 of 5 categories, it gets a hold rating. 4 of 5 gets a buy, and less than 3 gets a sell rating. Then I compare my rating to the consensus from analysts, Wall Street, and the SA quant system.
Then, I explain any upside or downside risks to my outlook.
Dividends
In this category, I will analyze the dividends of this stock and whether I think they present an opportunity for dividend-income investors. The data comes from official Seeking Alpha dividend info.
As of the writing of this analysis, the forward dividend yield is 1.51%, with a payout of $0.60 per share on a quarterly basis, with the most recent ex- date being July 6th.
Though this yield may seem a bit on the low side, as we have seen some in this sector lately pushing 5%, this is one factor only and next we will compare it to the overall sector.
Amex – div yield (Seeking Alpha)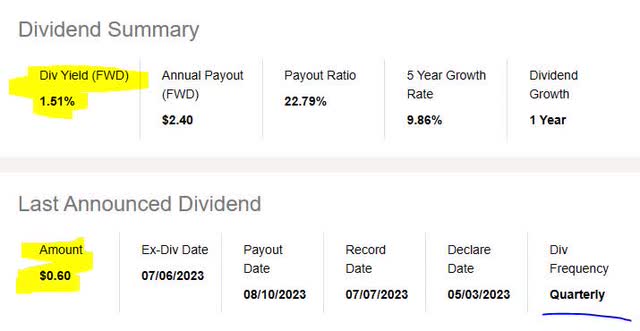
When comparing to its sector average, this dividend yield is 61% below its sector average.
I believe this could be a negative point to consider for dividend investors who are comparing multiple stocks in which to invest. In my opinion, my target range is 2% – 5%, to stay within a few points of the sector average. In this case, the yield seems low vs the average, and even got a “D-” grade from Seeking Alpha which does not add confidence to this stock.
Amex – div yield vs sector avg (Seeking Alpha)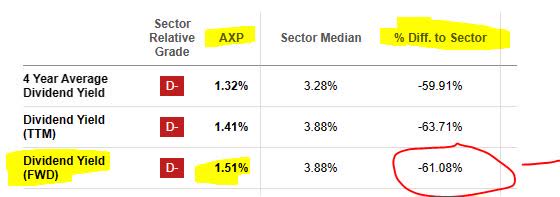
On a more positive note, in looking at the 5-year dividend growth for this stock, it has shown a positive growth trend. This is, in my opinion, a positive point for dividend investors and a sign of this firm’s capacity to return capital back to shareholders, which I think also points to capital strength as well.
Amex – dividend 5 year growth (Seeking Alpha)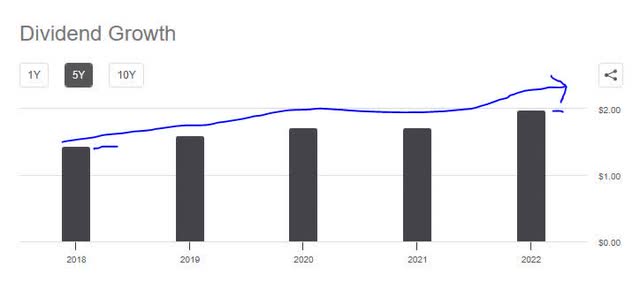
Further, I am looking for stability with dividend payouts, and this stock has shown regular dividend payment history lately without interruption, which is a positive point to think about. For example, you can see in the table below that the dividend payout increased twice in this period. Many readers rely on the steady quarterly payments a dividend stock provides, although not all investors have this strategy.
Amex – dividend history (Seeking Alpha)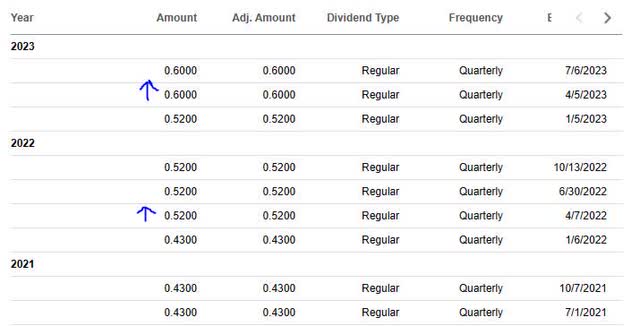
Based on the data, I would therefore recommend this company on the category of dividends, however it did not quite make my weekly “dividend quick picks” list this time around.
Valuation
In this category, I will analyze the valuation of this stock. The data comes from official valuation info on Seeking Alpha, specifically the forward P/E ratio and forward P/B ratio, the key metrics I look at.
This stock has a forward P/E ratio of 14.32, which is 50.20% above its sector average.
I think that a reasonable price to earnings for this stock would be between 8x earnings and 11x earnings, to stay within a reasonable 2-point range of the average. In this case, on this metric the stock appears too overvalued vs its overall sector.
Amex – P/E ratio (Seeking Alpha)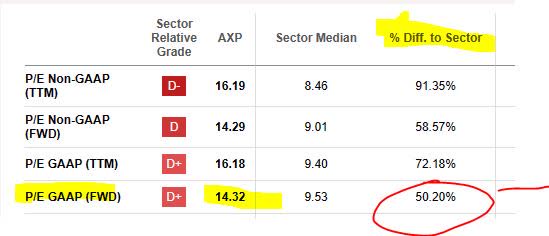
This stock has a forward P/B ratio of 4.12, which is a massive 314% above its sector average.
I think that a reasonable price-to-book value for this stock would be between 0.50x book value and 1.5x book value, to stay within a 1/2 point range of the average. In this situation, this stock appears severely overvalued vs its overall sector.
Amex – P/B ratio (Seeking Alpha)
Based on the examples I gave, I would not recommend this stock on the basis of valuation, as in both metrics it appeared too overvalued vs its industry.
Share Price
Next, I determine if the current share price is a potential buying opportunity based on my portfolio goal of buying at current price, holding for 1 year until Aug. 2024, and achieving an unrealized gain of +10%.
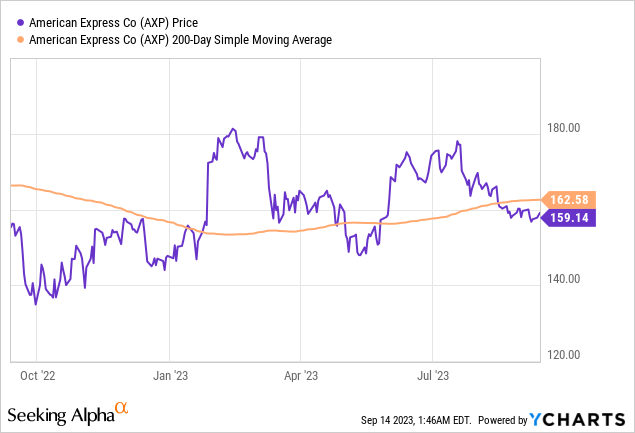
The price chart (as of the writing of this article) shows a share price of $159.14, compared to its 200-day simple moving average “SMA” of $162.58, over the last 1-year period. I like using the 200-day SMA as it is a long-term trend indicator that smooths out the trend nicely.
Next, I plug in the current SMA and share price into the following simulator I created, which simulates unrealized gains & losses if the share price as of Aug. 2024 reaches +10% above the current SMA but also if it drops -10% below the current SMA:
Amex – investing simulation (author analysis)
In the above simulation, my goal is to meet or exceed a +10% unrealized gain in 1 year, and I have a maximum loss tolerance of -10% unrealized loss.
Based on the simulation results testing the current buy price, I exceeded my goal for unrealized gains since I am projected a gain of 12.38% in this scenario, and I stay within my loss tolerance because my projected loss is 8.05%. Again, as a reminder, I am testing what happens if the stock reaches two future prices that are +/- 10% vs the current 200 day moving average.
In this case, I would recommend the current buying price and consider it within value-buying territory.
Since every investor has different profit goals and risk profiles, consider this simulator just a general framework to help think about this stock in a longer-term sense. In addition, many factors could cause the actual share price to move well beyond 10% up or down.
Earnings Growth
In this category, I examine the earnings trends over the last year, looking at both top-line and bottom-line results but also any relevant company commentary from the last earnings results.
First, I want to turn your attention to an important metric in a business like this and that is interest revenue.
A trend over the last year, which I would argue is the result of the Fed raising interest rates, is that interest-income has gone up for firms like this but also interest-expense has gone up too! I think this firm is managing that well since their net interest income (the difference between the two) has shown positive YoY growth.
Amex – interest revenue YoY (Seeking Alpha)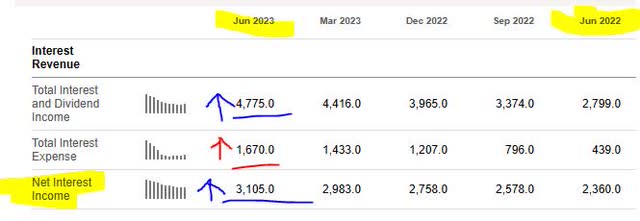
I am also looking for diversification beyond just revenue from interest, since the Fed eventually will have to lower rates again like it always does. In this case, this firm being a card / payments company at its core also makes money from commissions & fees, another metric that has seen YoY growth which I am impressed by.
Amex – commission & fees YoY (Seeking Alpha)
On the whole, its top-line grew on a YoY basis, which I want to bring your attention to:
Amex – total revenue YoY (Seeking Alpha)
However, I think the critical metric that every company on the planet keeps an eye on is the bottom line, and in this case American Express also saw YoY growth there as well:
Amex – net income YoY (Seeking Alpha)
To make sense out of what was driving this tailwind for earnings, I turned to Q2 commentary from Chairman & CEO Stephen Squeri:
Card Member spending hit another all-time high, growing 8% on an FX-adjusted basis, driven by double-digit growth in U.S. Consumer and International Card Member spending. Travel and Entertainment spending remained strong across customer categories and geographies, growing 14% on an FX-adjusted basis.
Also, I want to call out the following chart which clearly shows a consistent growth trend in cardmember loans / receivables. I find this relevant because the core business for American Express is credit cards, which it is known for across many decades, and I think earnings growth is linked in part to loan growth.
Amex – YoY growth in cardmember loans (company q2 presentation)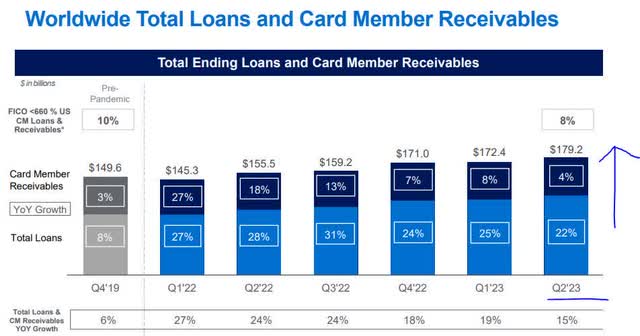
Based on this evidence as whole, I would recommend in this category and expect continued strong results in the next quarter that meet or exceed the prior results, since the firm seems to have the momentum already, so for Q3 I expect positive results again.
Financial Health
In this category, I will discuss whether the overall company shows strong financial fundamentals beyond just things like dividends, valuation, earnings and share price, with a focus on the capital strength.
The first thing to call out is that the firm continuously has maintained a CET1 ratio well above regulatory benchmarks, and this is a common metric to follow in banking. For instance, they had a 10.6% CET1 in the last quarter, vs 10.3% a year prior. Also, their return of capital to shareholders was $1.6B, also higher than a year prior. I think this points to stable and consistent capital strength.
Amex – CEt1 (company Q2 presentation)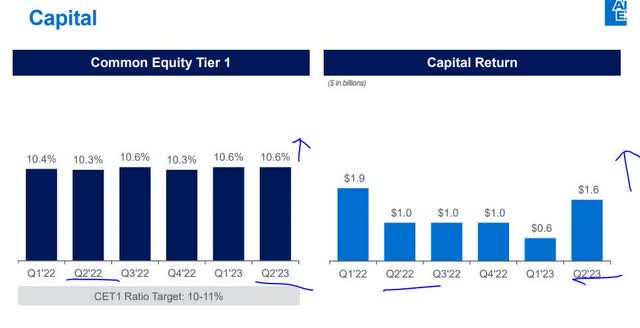
Next, I want to point to the fact that this firm has a diversified source of liquidity funding, as the charts below show, and what especially caught my attention and worthy to mention is that 92% of retail deposits in Q2 were FDIC insured. This topic became a huge issue this spring after the failure of a few regional banks in the US that were exposed to a high level of uninsured deposits.
Keep in mind that American Express has a “bank” component not just a card business, and it offers standard bank deposit products as any bank, so it also provides an inflow of funding. A good sign is if those deposits are increasing each quarter or year rather than decreasing and flowing to other banks.
Amex – funding sources (company Q2 presentation)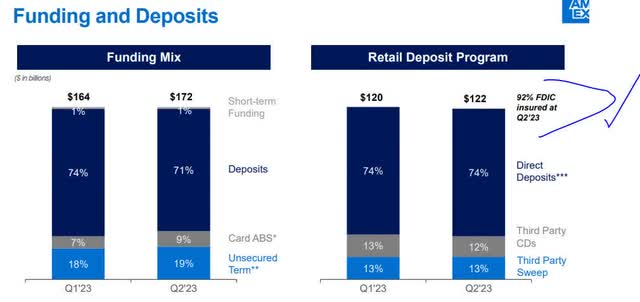
Also, the firm’s most recent cashflow statement shows a positive cashflow per share of $4.79, with 5 of the 6 last quarters being positive. In addition, the firm has achieved positive equity going back to at least Sept 2021, according to their balance sheet.
Based on the data, I recommend in this category, and consider it a firm with solid fundamentals.
Rating Score
Today, this stock was recommended in 4 of my 5 rating categories, earning a buy rating from me today, and the first time I am rating this company.
This time, I am agreeing with the consensus from my fellow SA analysts, but am being more bullish than Wall Street and the SA quant system:
Amex – rating consensus (Seeking Alpha)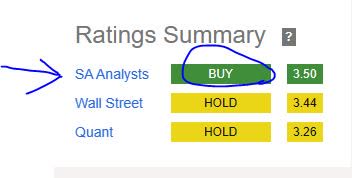
My Rating vs Downside Risk
My bullish rating can face a downside risk as follows, considering this is primarily a credit card business at its core:
Net charge-offs and past due or delinquent customers, which has been talked about in media lately and so I think investors and other analysts may feel bearish on stocks like this when hearing such news.
Consider that industry portal Risk.net highlighted this trend in a late August article:
Net charge-offs at US banks climbed further in the second quarter, as the growing size of unrecoverable debt continues to weigh on lenders’ balance sheets.
Synchrony reported the highest rate of the group, as net charge-offs climbed 26 basis points to 4.75%. Discover’s rate rose the most, by 50bp, to 3.22%.
However, my counterargument is that while both net write-off rates and past-due ratios have climbed at American Express also on a YoY basis, as the table below shows, they have not gone up by a drastic amount, and in fact compared to Discover it appears that Amex is sitting below 2% on those ratios, which I think is still safe territory.
Amex – card metrics (company q2 presentation)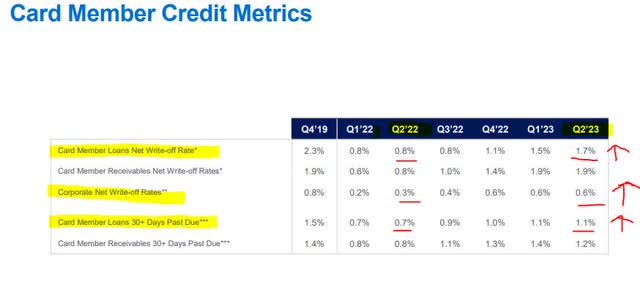
So, my bullish rating stands. However, I may revisit the above numbers again after their Q3 results to see if there is a significant rise or not by then, and I think it if goes past 3% it could be of increased concern.
Analysis Wrap Up
To wrap up today’s discussion, here are the key points we went over:
This stock got a buy rating today.
Its positive points are: dividends, share price, earnings growth, financial health of company.
The headwinds it faces are: valuation vs sector
Downside risk of net charge-offs has been addressed.
In closing, I think American Express should be added to a watchlist of financial sector stocks particularly as it is an industry leader in card payments, and has long ago reached a global scale. I think the numbers justify a bullish sentiment at this time.
I also will pose a question for readers to participate in the comments section: if the Fed keeps rates the same for the rest of 2023 or even raises them further, do you think that credit will become just too expensive and will curtail spending, thereby decreasing card transaction volumes by Q4?
As of now, CME Fedwatch predicts a 32% probability of another rate increase after the Fed’s November meeting. Just something to think about!
Read the full article here


Leave a Reply