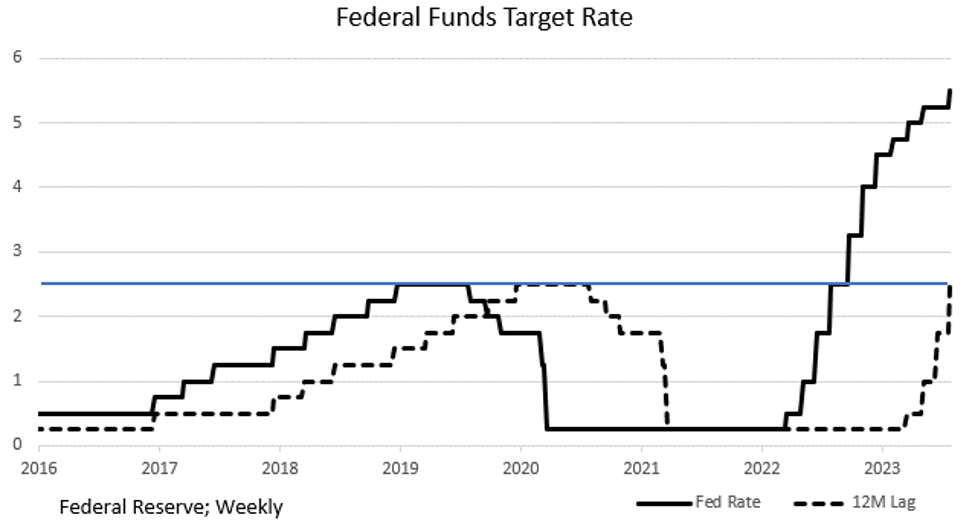
Several weeks ago, we described the effectiveness of monetary policy on the economy if it acted with a 12-month lag. The San Francisco Regional Federal Reserve Bank recently published research showing the lag to be 11 months. The Fed has also indicated that the “neutral” Fed Funds rate is 2.5%, so effective rates below 2.5% are accommodative and those above 2.5% are restrictive. In July, 2022, the Fed Funds rate was 2.5%. So, according to the SF Fed, up until June, 2023, Fed policy actually remained “accommodative.” Of course, the Fed has continued to rapidly raise rates. The economy has shown signs of weakening as the rate rises have moved toward restriction. As seen from the chart, given the lags, “restrictive” policy is about to bite, and bite hard!
From Growth to Recession
A Recession just doesn’t appear one day. It is a gradual process that takes the economy from positive to negative growth. Economist David Rosenberg, in his recent daily missives, has pointed out that in going from positive to negative growth, the economy must transition through zero growth. His conclusion is that we are close to that today, and, perhaps, that is what the “soft-landing” proponents are looking at. For us, the important question to ask, and one that is answered by our chart, is: If we have miniscule growth today, when the effective rate has just reached “neutral,” what is the likely growth path for the economy as the effective rate more than doubles over the next year? The logical conclusion: negative growth, i.e., Recession.
Incoming Data
- It is widely held by economists that the trillions of dollars of giveaways by the federal government have run their course, i.e., have been spent and are no longer available to support consumption. Consumer savings have fallen significantly below their pre-pandemic levels, so consumers would now have to borrow to keep consumption at current levels. And borrow, they have, as credit card balances have now reached a $trillion.
- And, just as borrowing has soared, so have delinquencies. And don’t you just know it, those terrible banks have all tightened their lending standards. We see this from the Fed’s SLOOS (Senior Loan Officer Opinion Survey) and from other business surveys including the Fed’s own Beige Book which noted slowing demand and easing inflation concerns.
- Jobs aren’t as easy to get as they were a year or so ago. The chart shows hires (green line) have fallen dramatically from their peak in November 2021 and quits (red line) are off significantly from their peak in April 2022. The latter are also showing quite dramatic recent deceleration. The unemployment rate ticked +0.3 pct. points higher in August.
We don’t think it is just coincidence that all the above occurred just as the “effective” Fed Funds rate (i.e., the lagged rate shown in the top table) became restrictive.
- Over the short-term, we also have the end of the student debt repayment moratorium. Beginning in October, $1.77 trillion in student debt must restart monthly payments. Using a 3% interest rate and 20-year repayment period, that removes $9.8 billion from consumption/month, in the -0.4% percent area. That’s quite significant.
- And there are growing concern that there will be a stalemate between the Republican majority in the House and Senate and the White House over funding at September’s end which may cause a government shutdown. That will have a large negative impact on GDP.
- Real Retail Sales (adjusted for inflation) are falling, declining by -0.1% in August and down -1.2% from year earlier levels. During the summer months, including August, in anticipation of the now ongoing auto strike, the auto makers ramped up production. This has had a large impact on reported economic activity due to the impact from the seasonal adjustment process (the seasonals expect a slowdown, not a speed up of production during the summer as plants normally are shut to retool). Of course, this will all reverse during the strike if it is of any significant length.
Now Beaten Inflation
As we have discussed in past blogs, it appears that inflation has already been defeated. We are not sure why the Fed continues to push the “higher for longer” theme. Perhaps they fear an over-reaction by markets if they show any signs of dovishness. Referring back to the chart at the top of this blog, a lowering of rates today won’t have an impact for 11-12 months, by which time the economy will have been in Recession for several quarters.
Lowering rates now, even if late, only makes sense. But this doesn’t appear to be in the cards for this Fed. Perhaps they are still reeling from their embarrassing “transitory” call on inflation and are trying to show high resolve. Key in the upcoming meeting will be the “dot-plot.” If the dots show lower end points, which they should, fixed-income markets will rally. The Fed may not want this to happen yet until they are all comfortable that lower rates won’t encourage renewed inflation. As a result, we may not see the truest picture of the FOMC rate views in the upcoming dot-plot.
CPI
In August, the year-over-year rate of inflation kicked up to 3.7% from 3.3%. Almost all the rise was due to the 10.6% July to August rise in the price of gasoline caused by new production reductions from our friends in Saudi Arabia and Russia compounded by drilling restrictions from the Biden Administration.
The CPI is also heavily influenced by changes in the cost of shelter which compose nearly one-third of the monthly CPI calculation. The monthly changes in the non-shelter components of the CPI are simply a comparison of the current price to last month’s price, like, for example, the price of gasoline (i.e., up 10.6% in August vs. July). But when it comes to shelter costs, whose weight in the CPI is about one-third, BLS uses a different methodology. Instead of the cost of a lease this month vs. last month, the way the other two-thirds of the index is calculated, BLS uses a pricing method that calculates price changes across all leases, not just recent ones. So, the weight of past leases makes recognition of price changes painfully slow. The result of this trickle down is that, in the current situation, it is biasing the index to the high side.
The chart shows the CPI (red line) along with the current rental component used by BLS (blue line). Note that, using the BLS methodology, shelter costs (rents) just recently peaked. But, the Apartment List Index (purple line) shows that rent inflation actually peaked sometime in late 2021 and early 2022. Note that while BLS is now using +8.0% for rents in the CPI, the Apartment List Index is now showing negative month over month results. This, of course, ties in with rapidly rising vacancy rates and a glut of new apartment units now coming to market.
There is little doubt that the current CPI reading (3.7%) is biased to the upside. A back of the envelope calculation, using the Apartment List -1.2% rate instead of BLS’s trickle down (8.0%) method would have produced a CPI in the +1.2% range for August. In reality, the economy may very well end up with a Deflation issue.
The good news is that, even using BLS’s flawed methodology, rents will be pulling CPI down for the foreseeable future even if the Fed just stands pat. The table below shows what Headline CPI and Core CPI (ex-food and energy) will be at 12/31/23 and 6/30/24 if monthly Headline CPI grows +0.2% and +0.1% and monthly Core (stickier) grows at +0.3% and +0.2%. Our view is the lower numbers.
Final Thoughts
Because of the lags in the effectiveness of monetary policy, restrictive policy is just beginning to be felt. Add to that the fact that M2 money supply growth is negative (first time in history), and all schools of economic thought point to the same conclusion: Recession.
From a growth phase to a Recession phase, the economy must pass through a period of zero growth. That’s where the economy is now, and the Wall Street economics departments are calling for that to continue, i.e., a soft landing. Unfortunately, the lags in monetary policy say otherwise.
Cash from the federal government various giveaway programs has been spent, the volume of retail sales has stagnated, jobs are harder to find, loan delinquency rates are rising, and the banks have all but stopped the flow of credit. And another federal spending spree is off the table.
It is a near certainty that the Fed will not raise rates at its upcoming September conclave. We know that “higher for longer” will be a theme. Key for the markets will be the new dot-plot.
The war on inflation has already been won; the Fed just doesn’t recognize it yet.
(Joshua Barone and Eugene Hoover contributed to this blog)
Read the full article here